Research
A Deterministic Approach to Operational Data Modeling from Recurrent Semi-Structured Inputs
Read more
Introducing Spaces
Files, exports, and external systems feed data into your pipeline through automated ETL.
Everything converges into a single unified foundation your entire team can trust and query.
Reports, dashboards, apps, and AI conversations — all powered by the same reliable data.
Setup
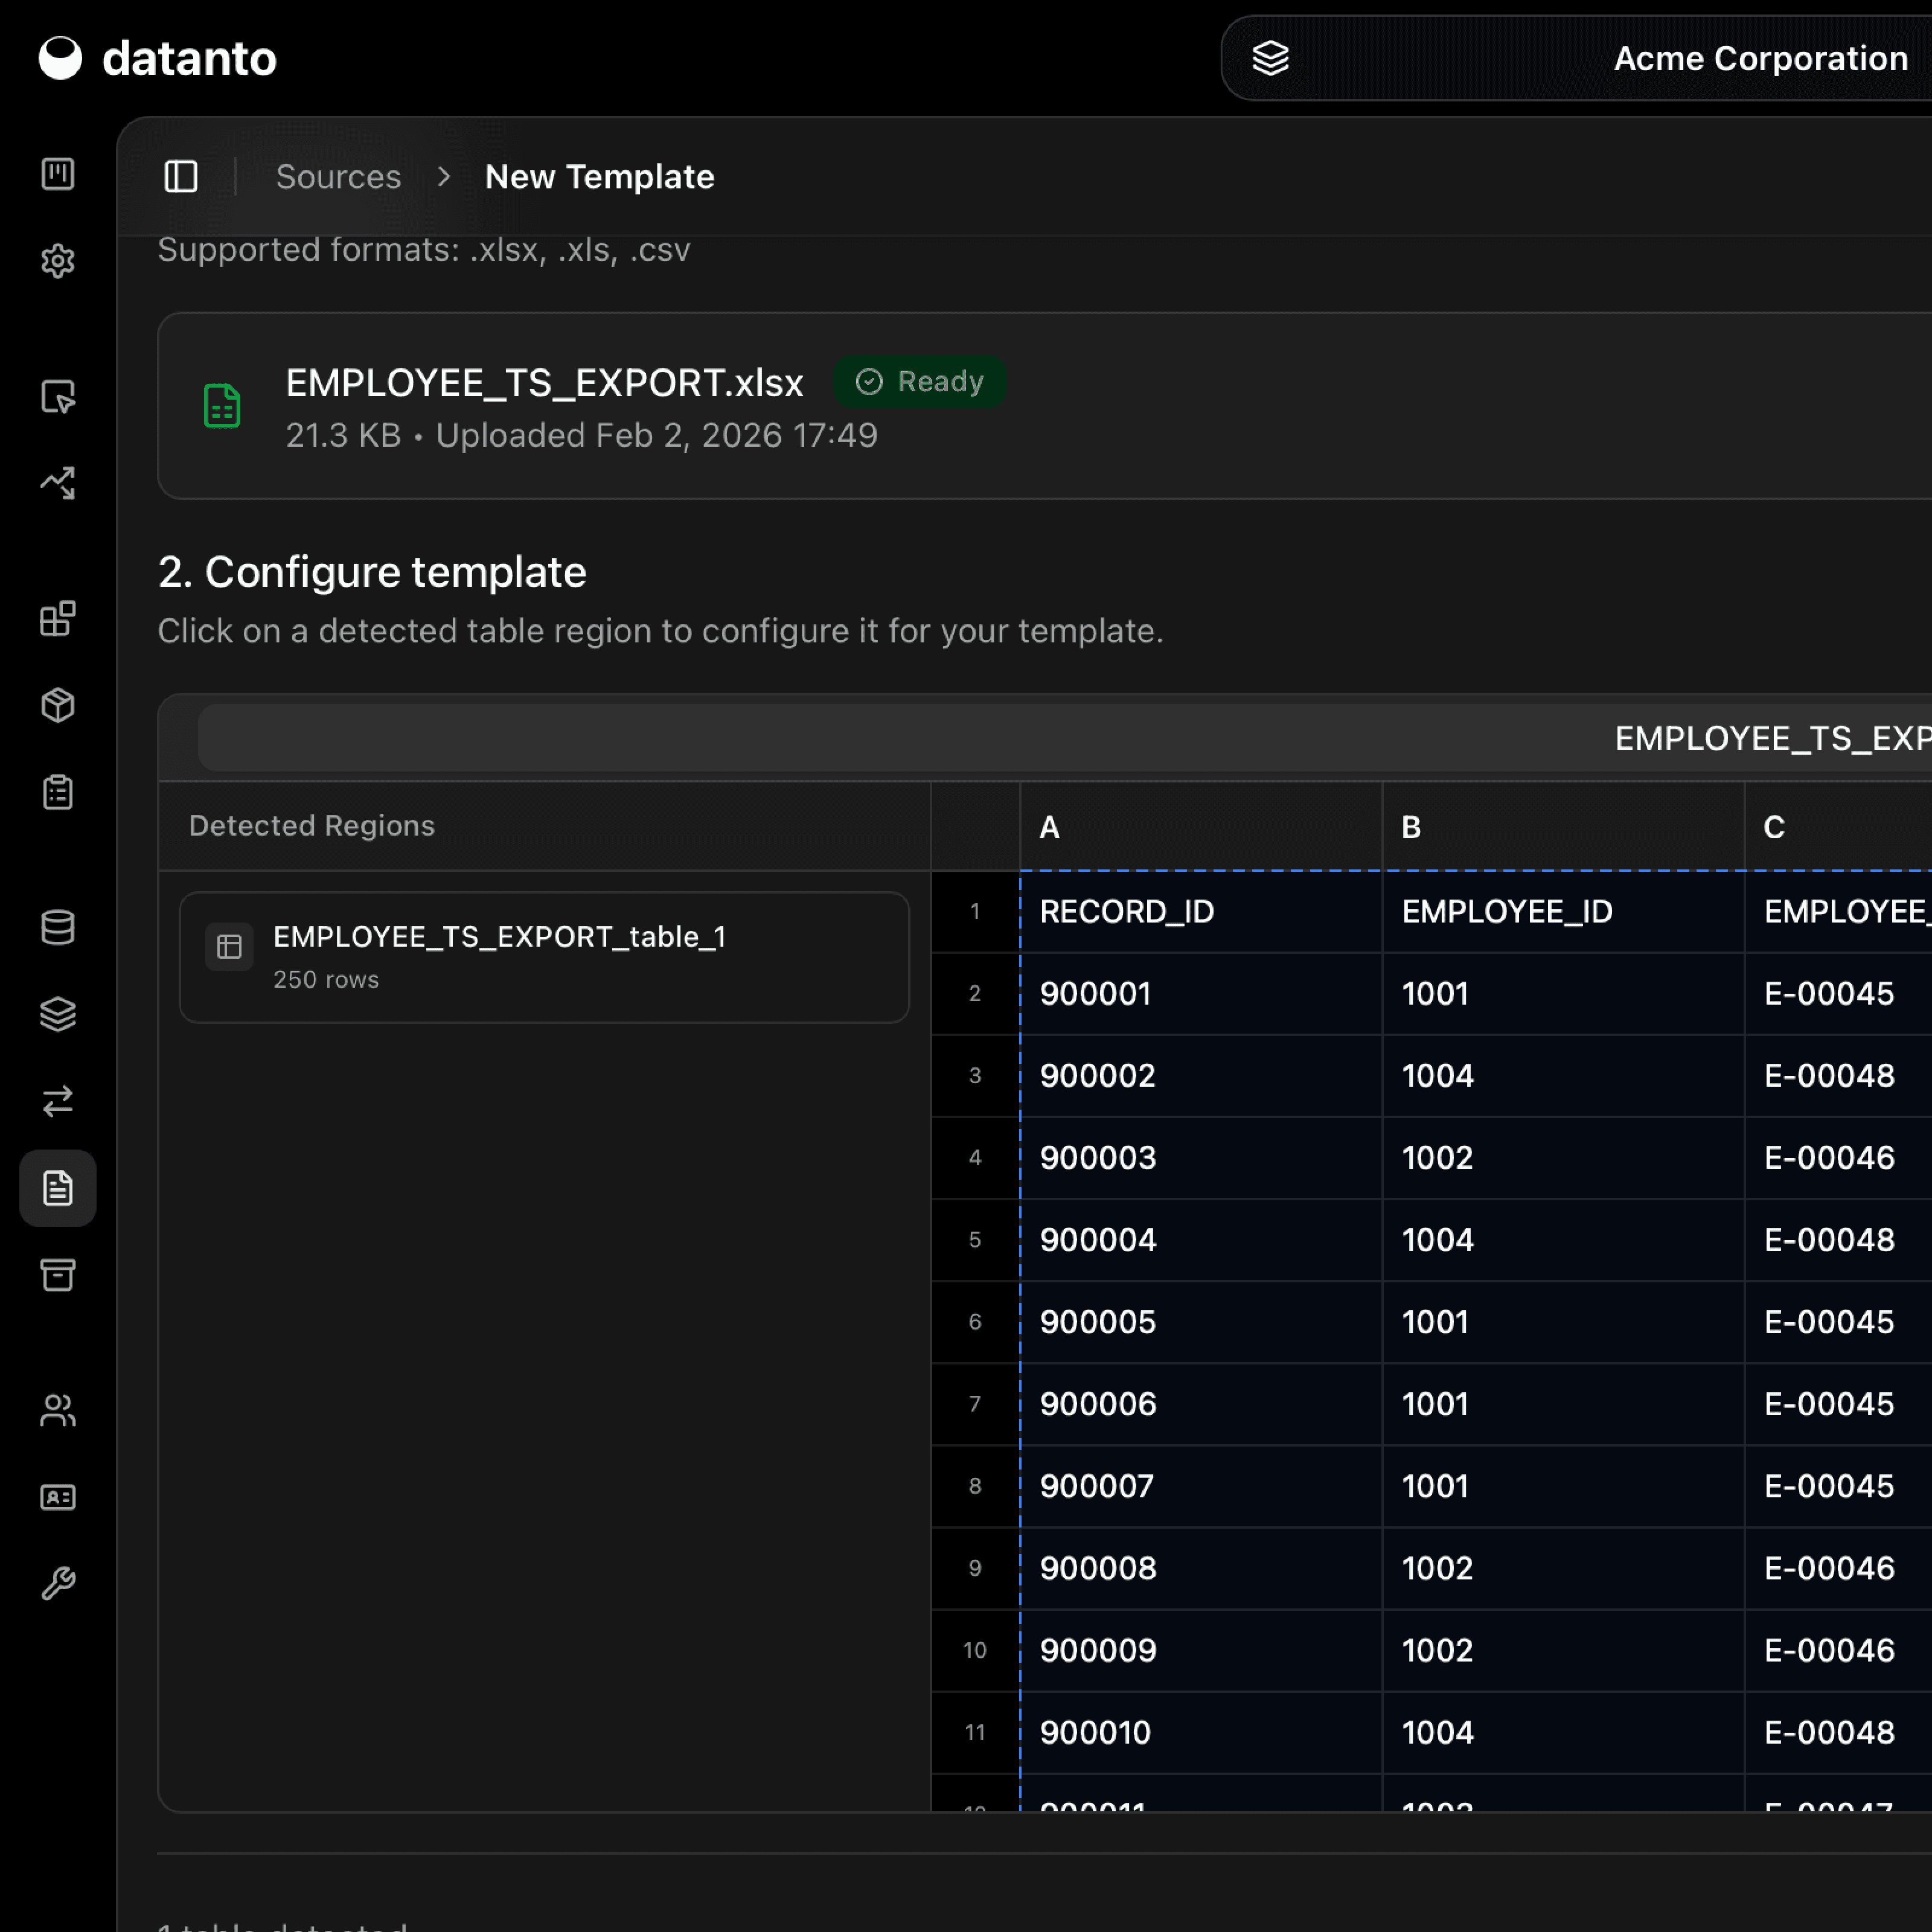
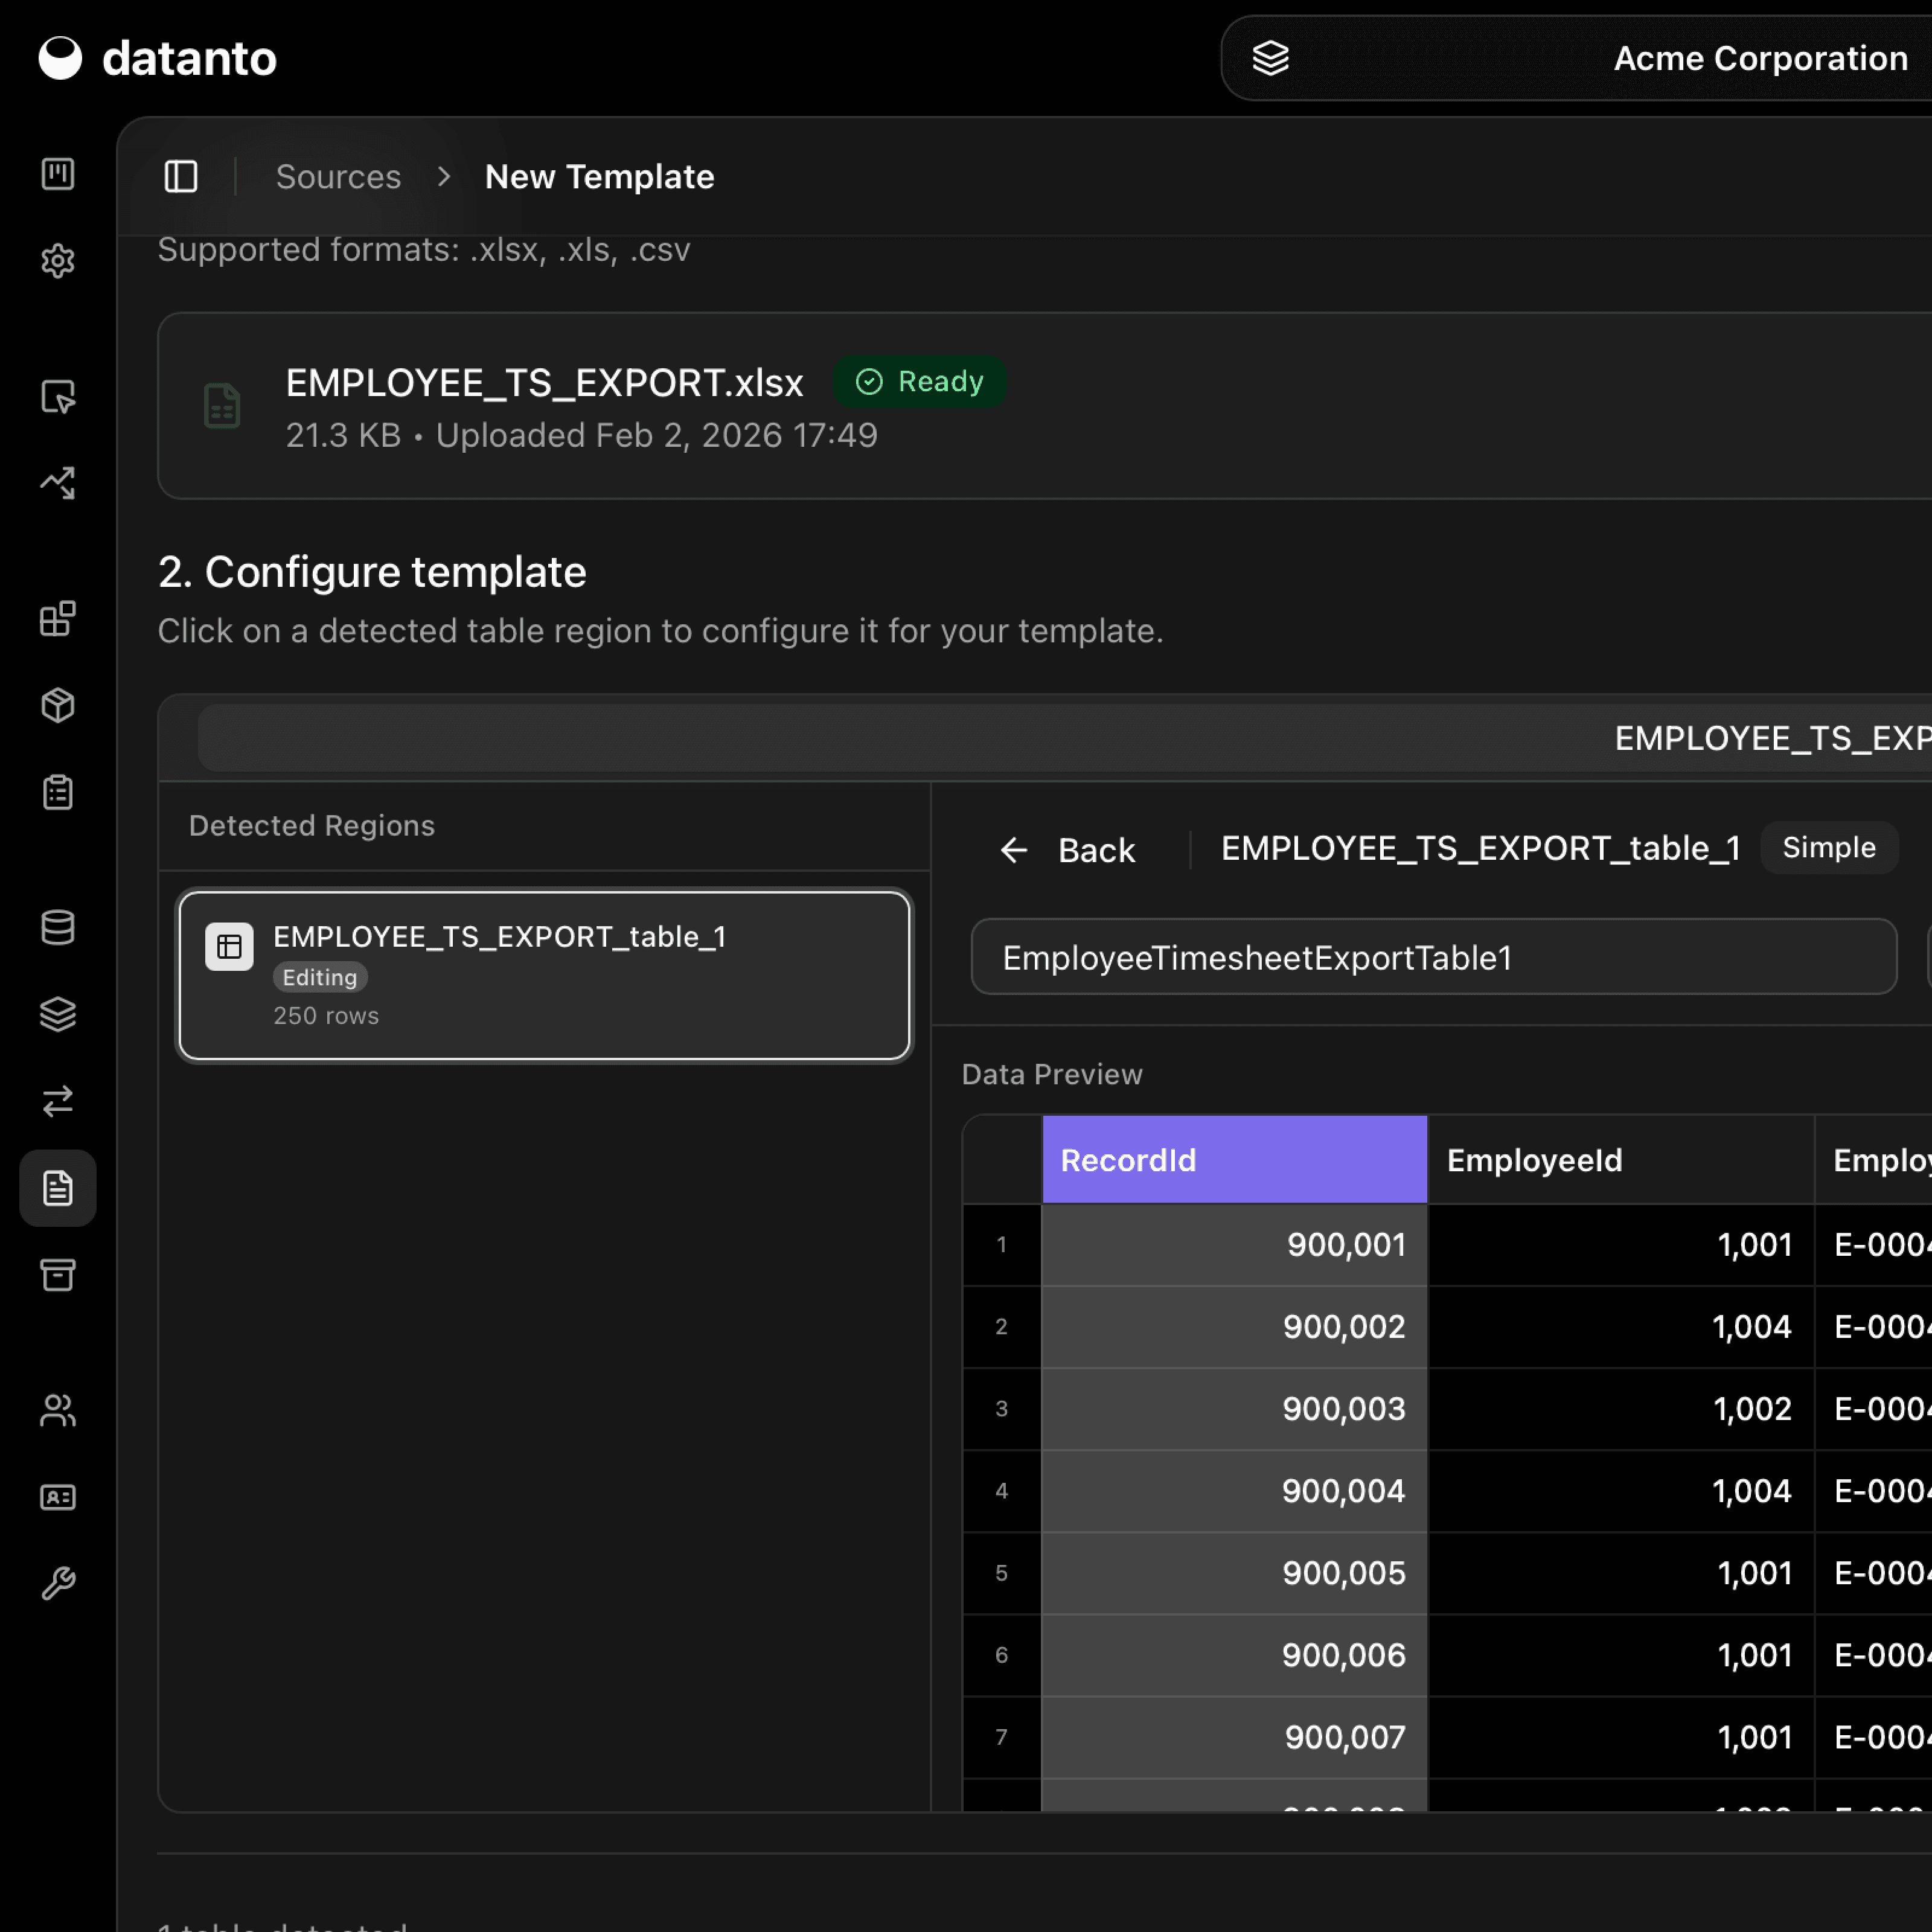
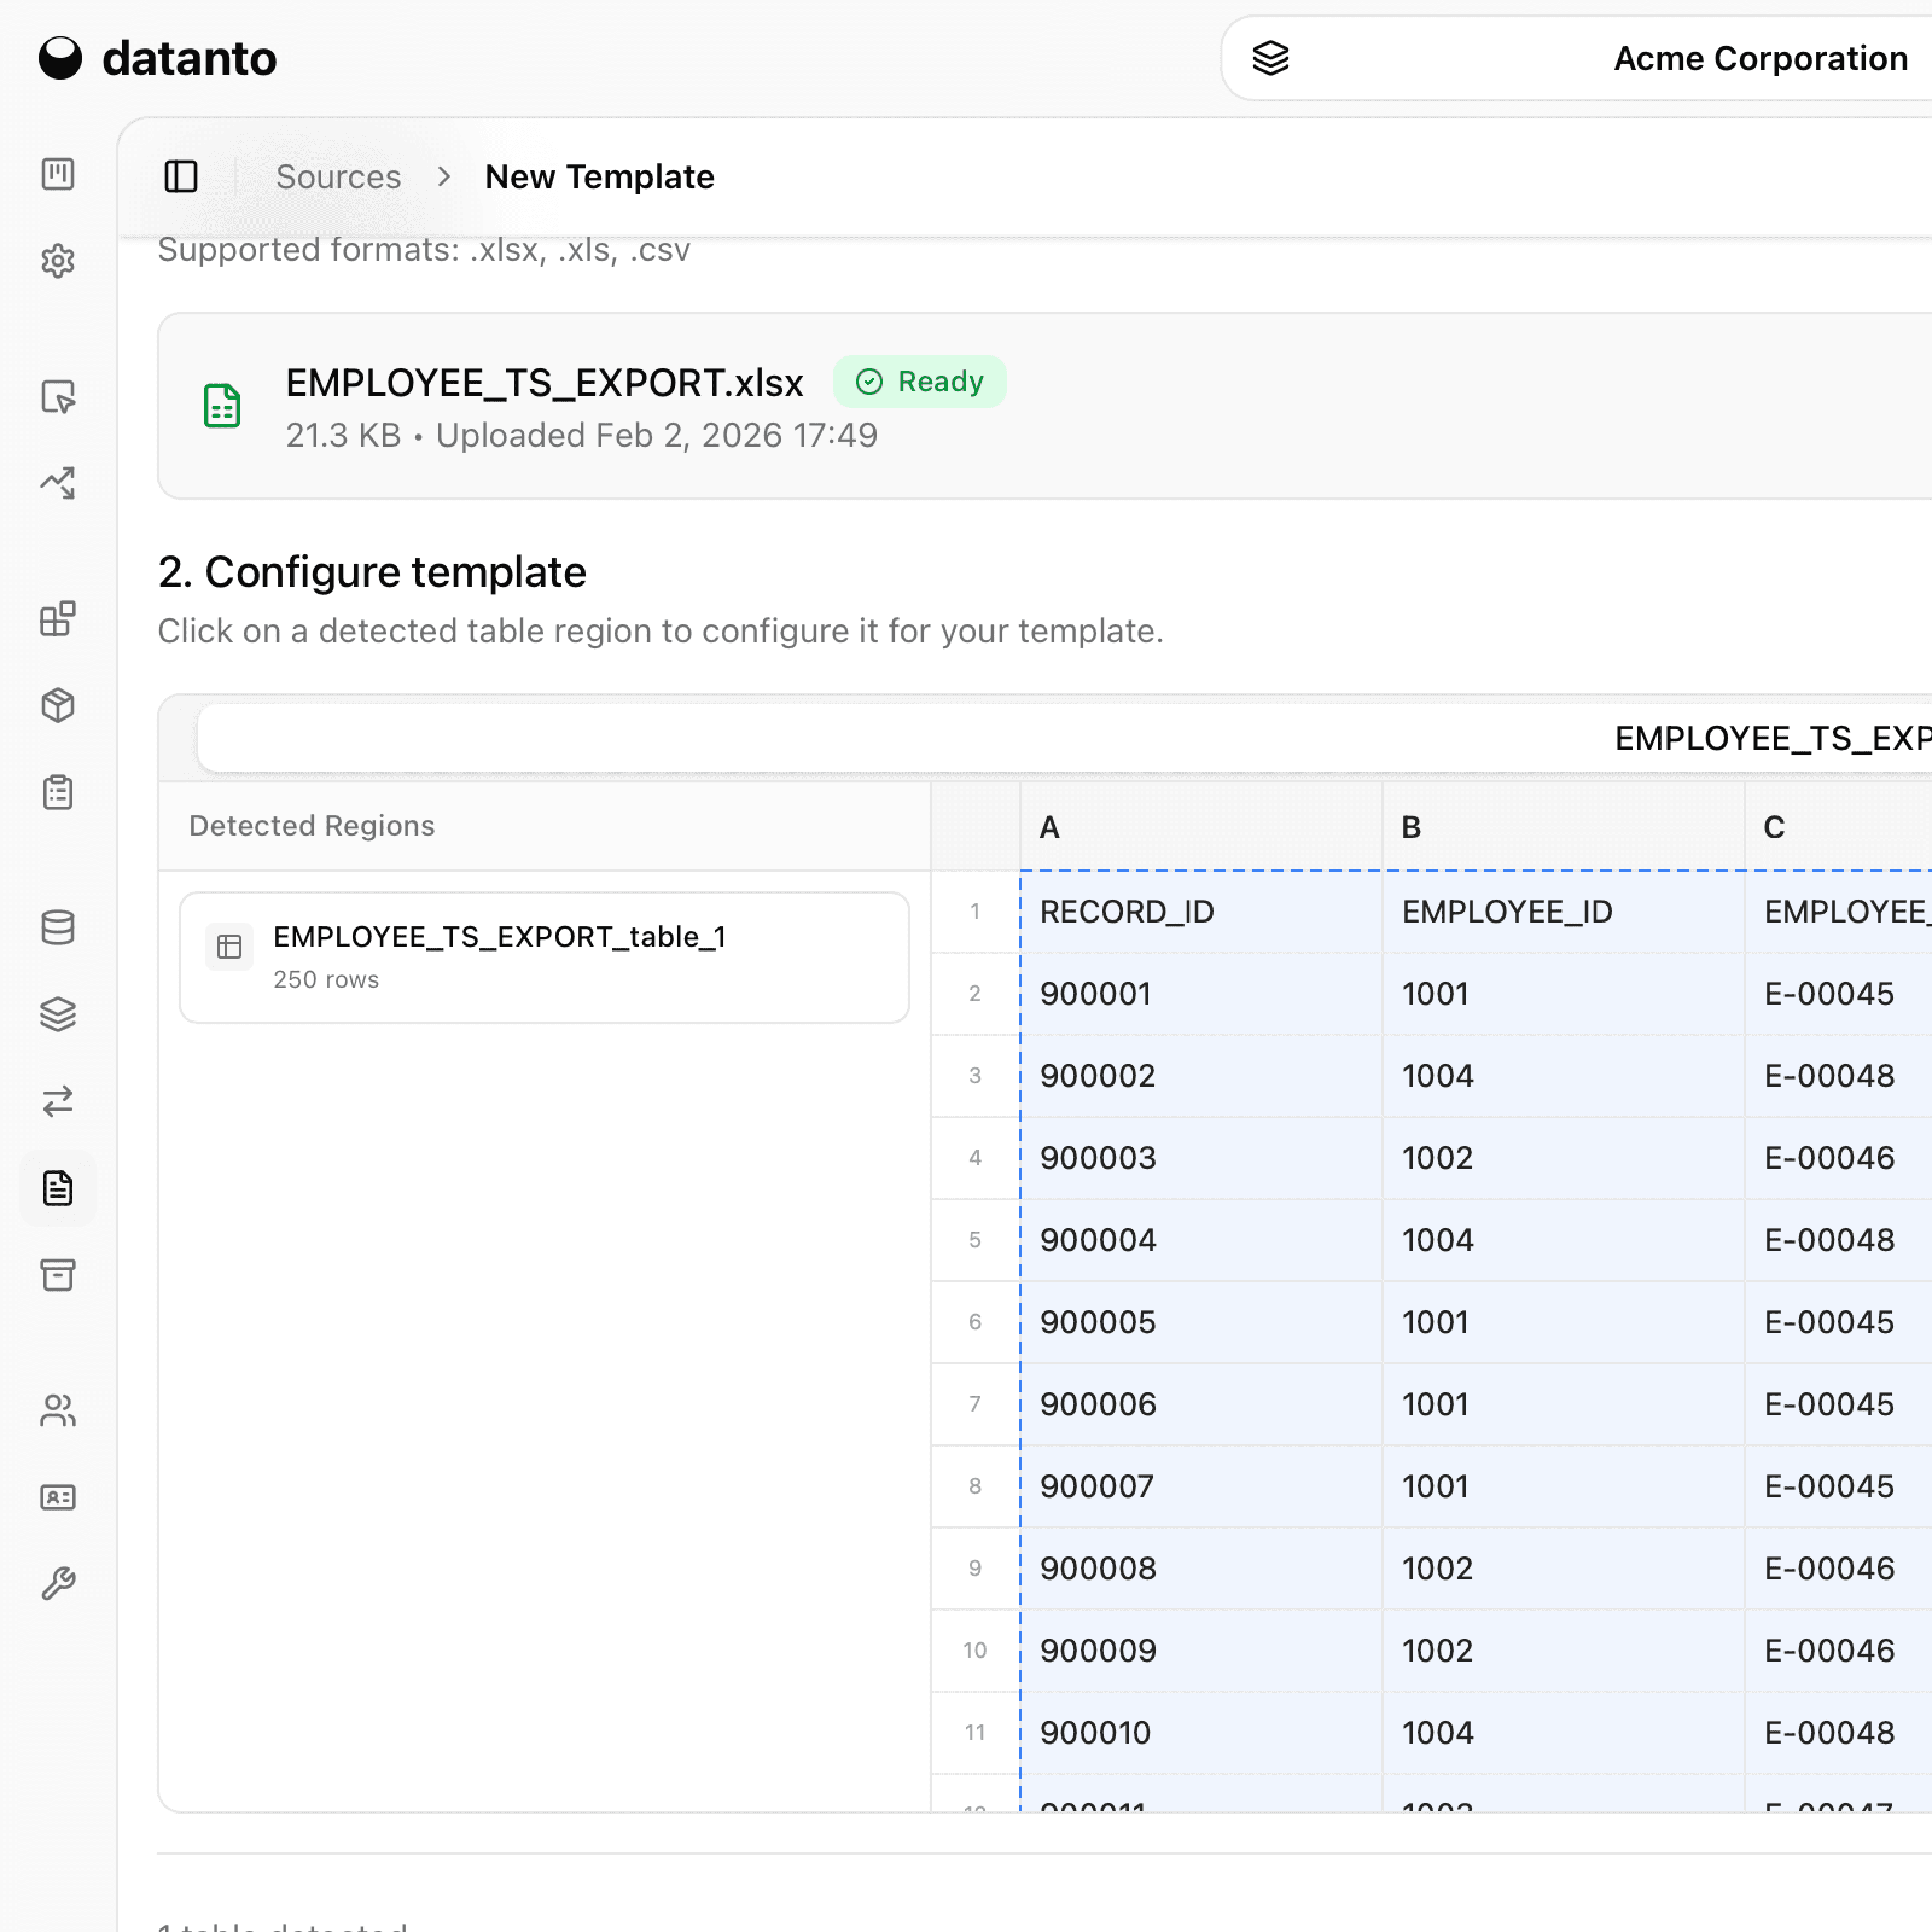
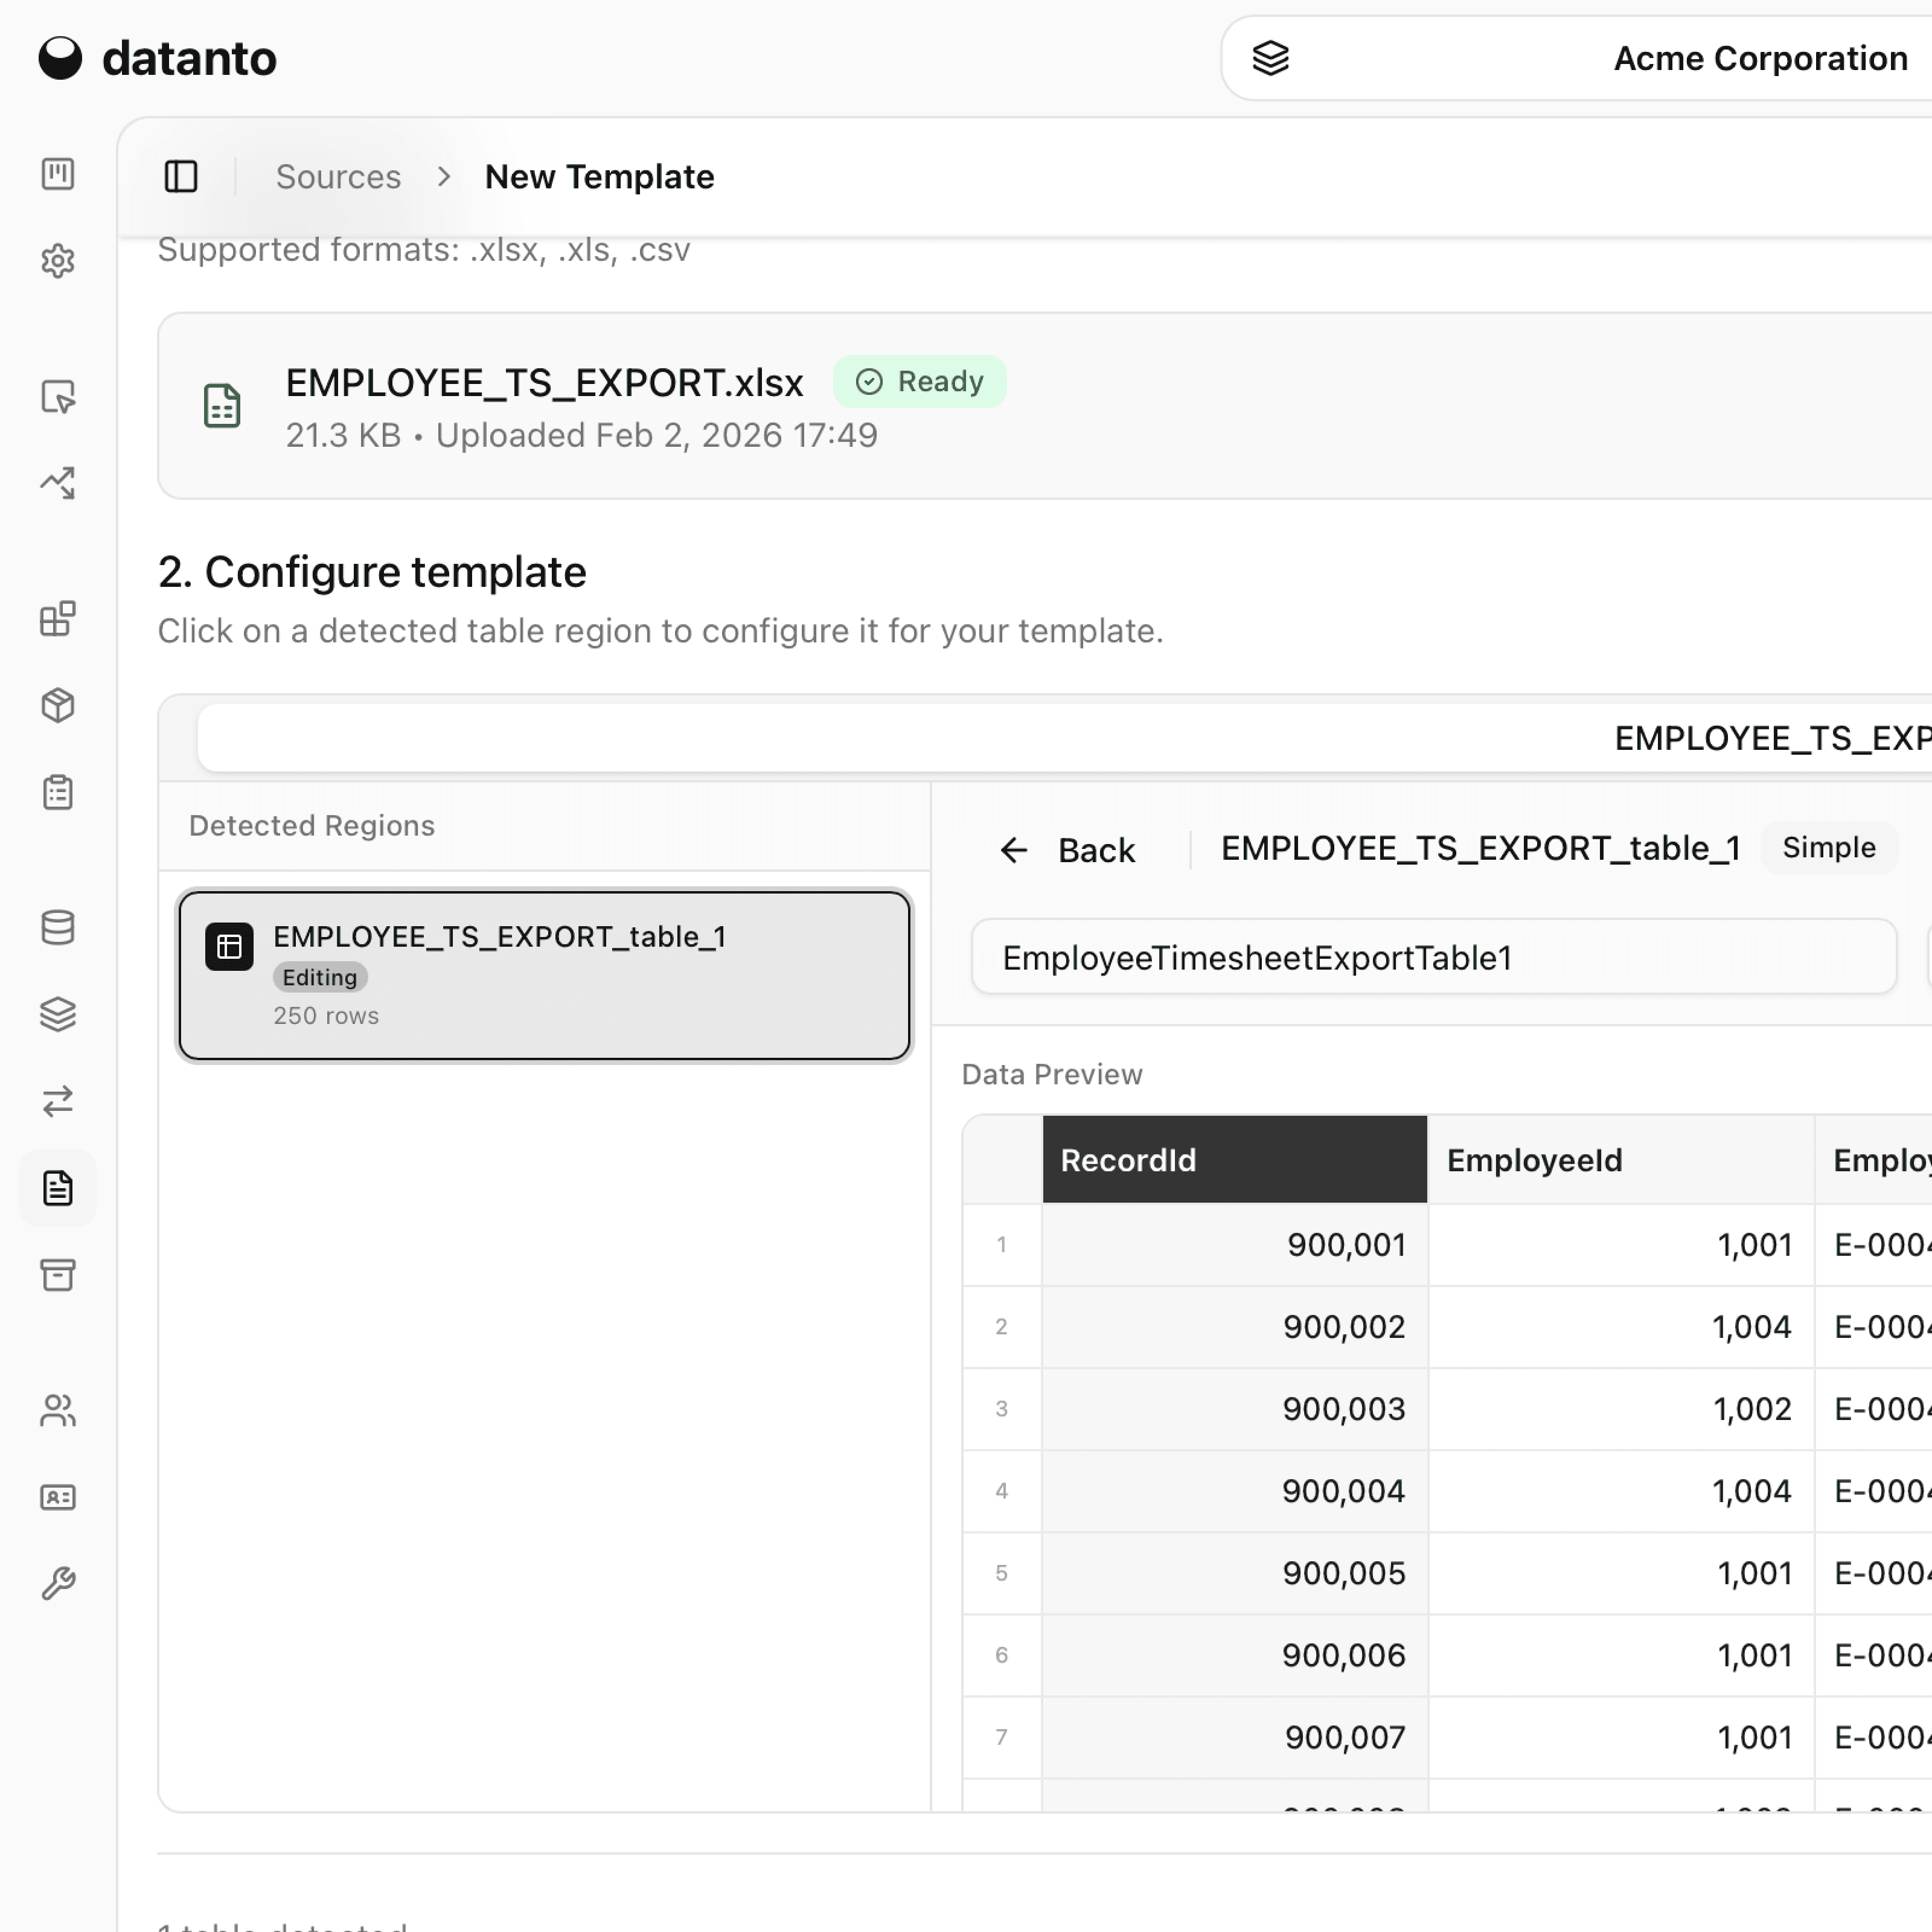
Upload your files. Datanto analyzes patterns and asks business questions to understand your operations.
Based on your context, Datanto suggests what to build first. Choose from proposals or describe what you need.
Datanto builds your semantic model, pipelines, apps, reports, and views. All connected. All consistent. All evolvable.
Human-in-the-loop. The AI generates proposals automatically. You review, refine, and approve.
Based on your business context
Weekly P&L by location
Revenue, costs, and margins broken down by restaurant
Labor cost tracking
Hours, wages, and overtime by role and shift
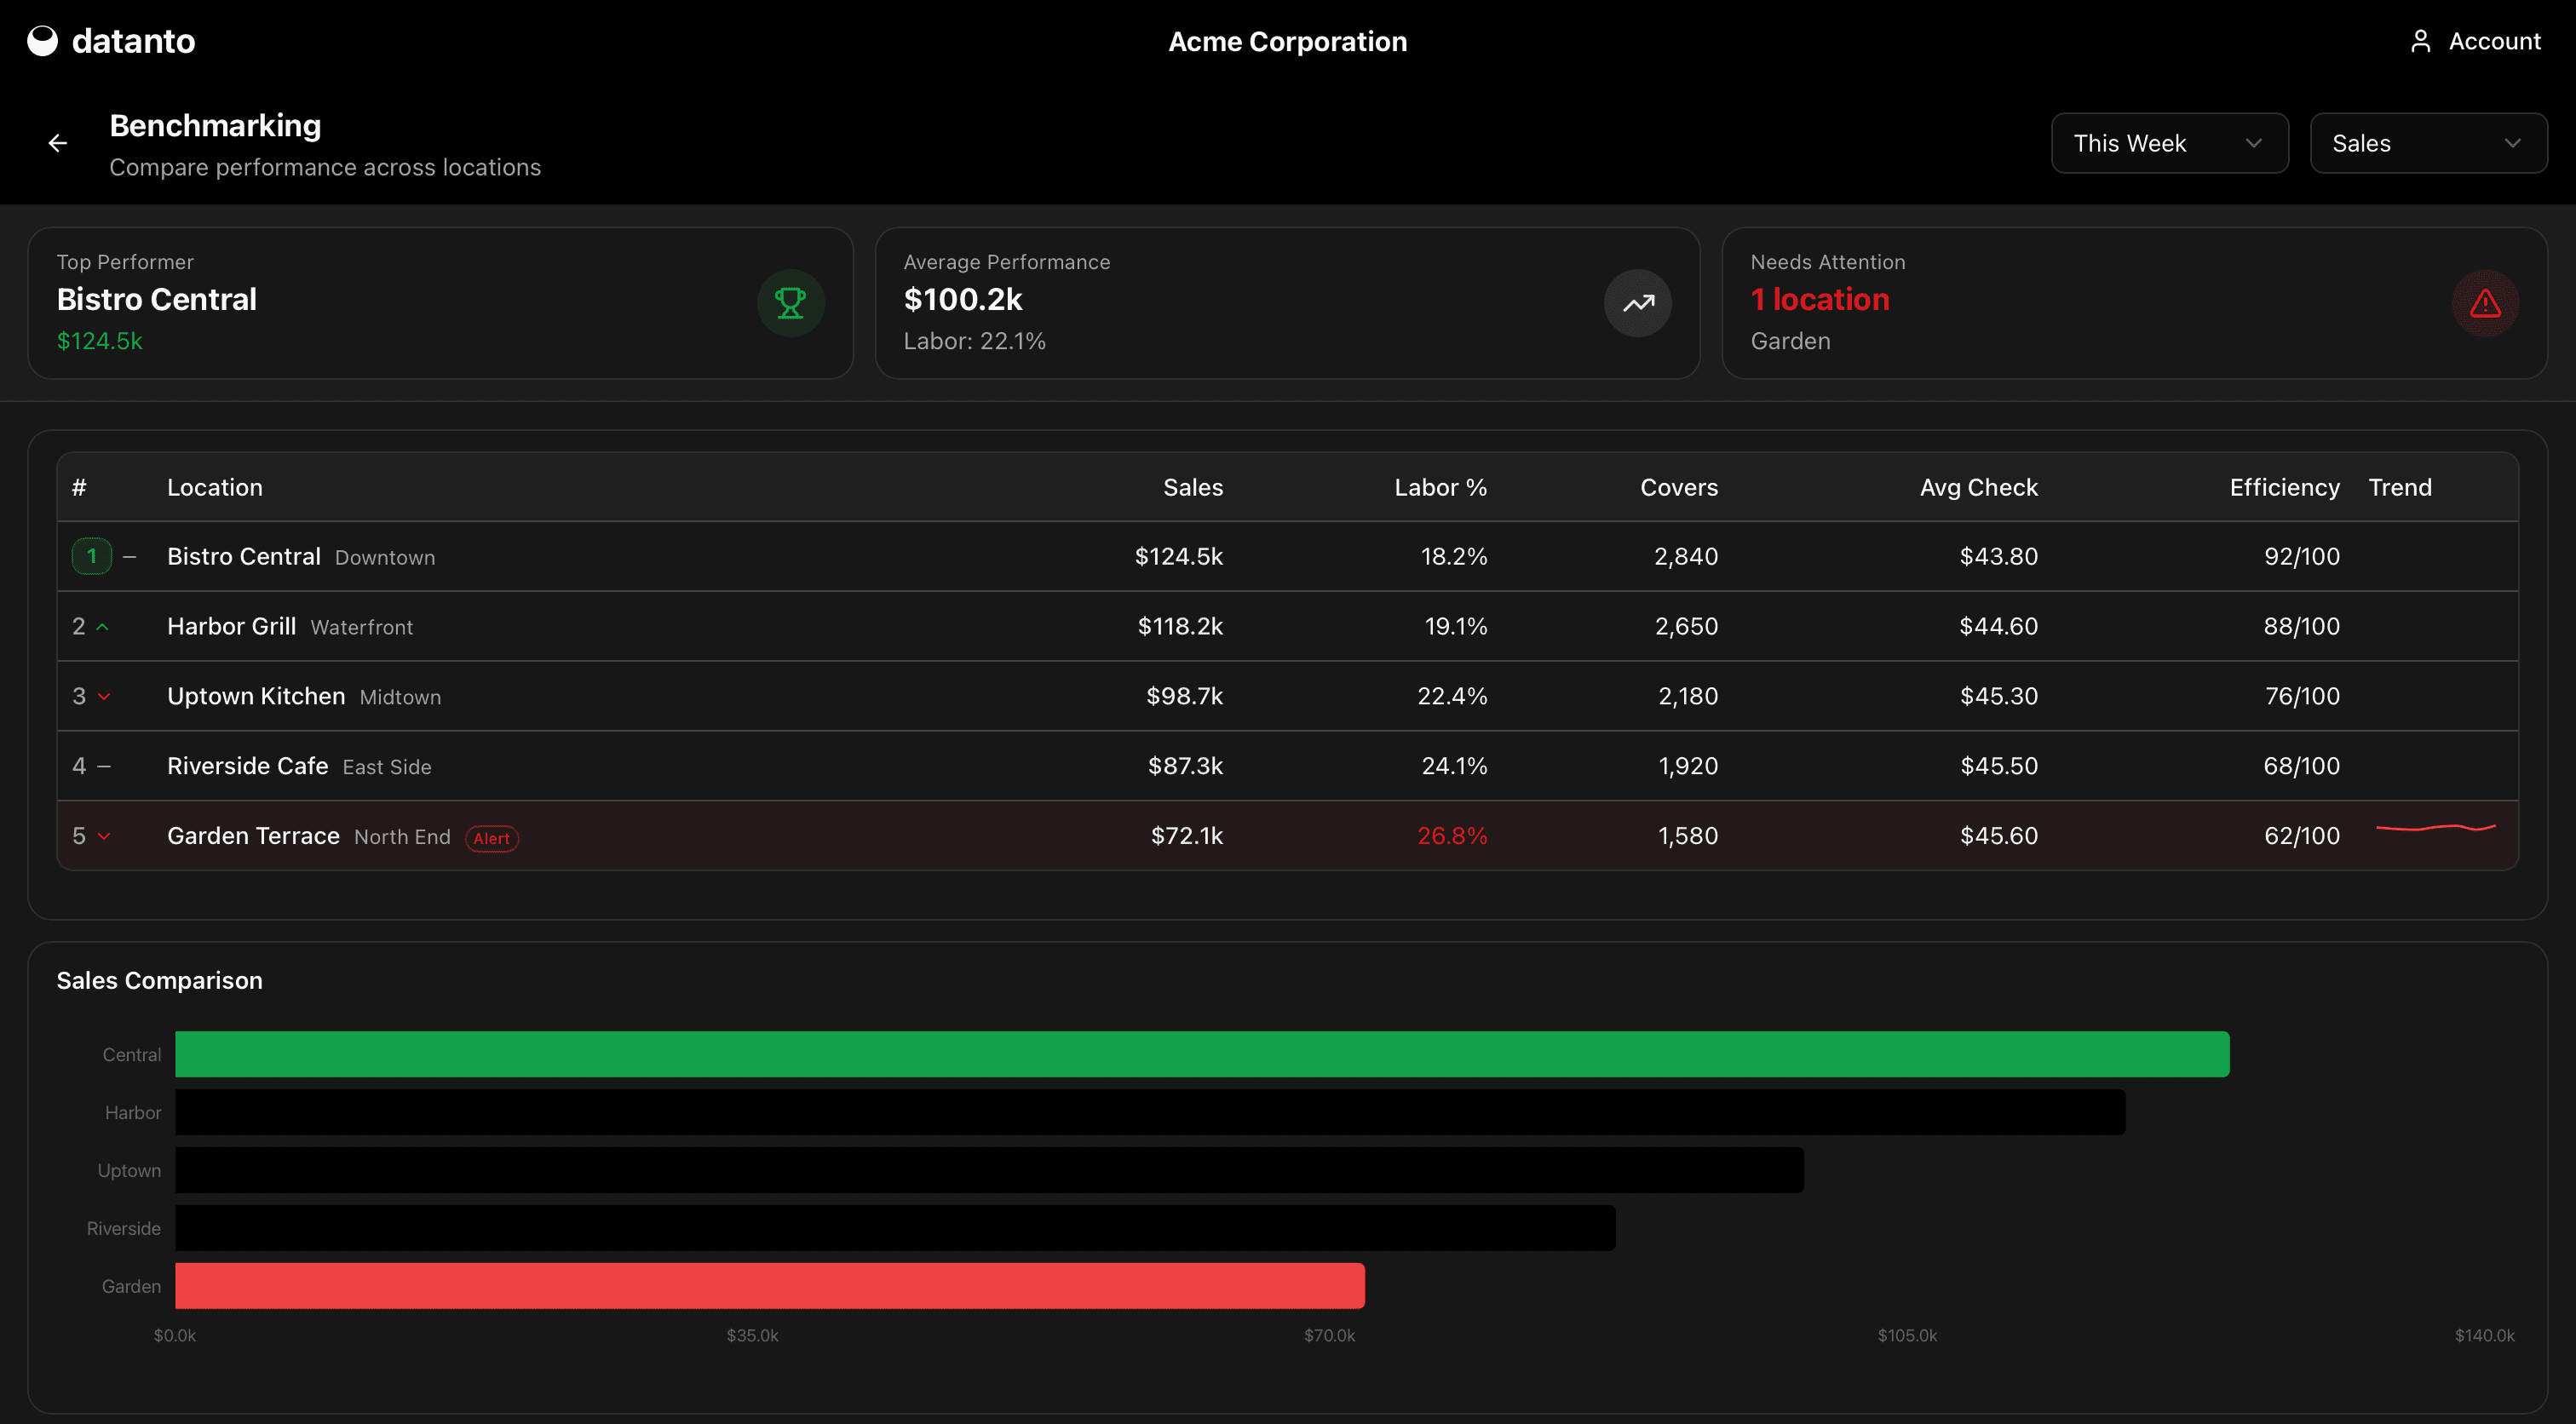
Sales performance dashboard
Daily sales, covers, and average ticket by daypart
Ingestion
Extract, transform, and load data from any source automatically.
Plug into your existing tools — CRMs, spreadsheets, APIs.
Automated workflows that keep your data fresh and consistent.
Track every change. Roll back when needed. Full audit trail.
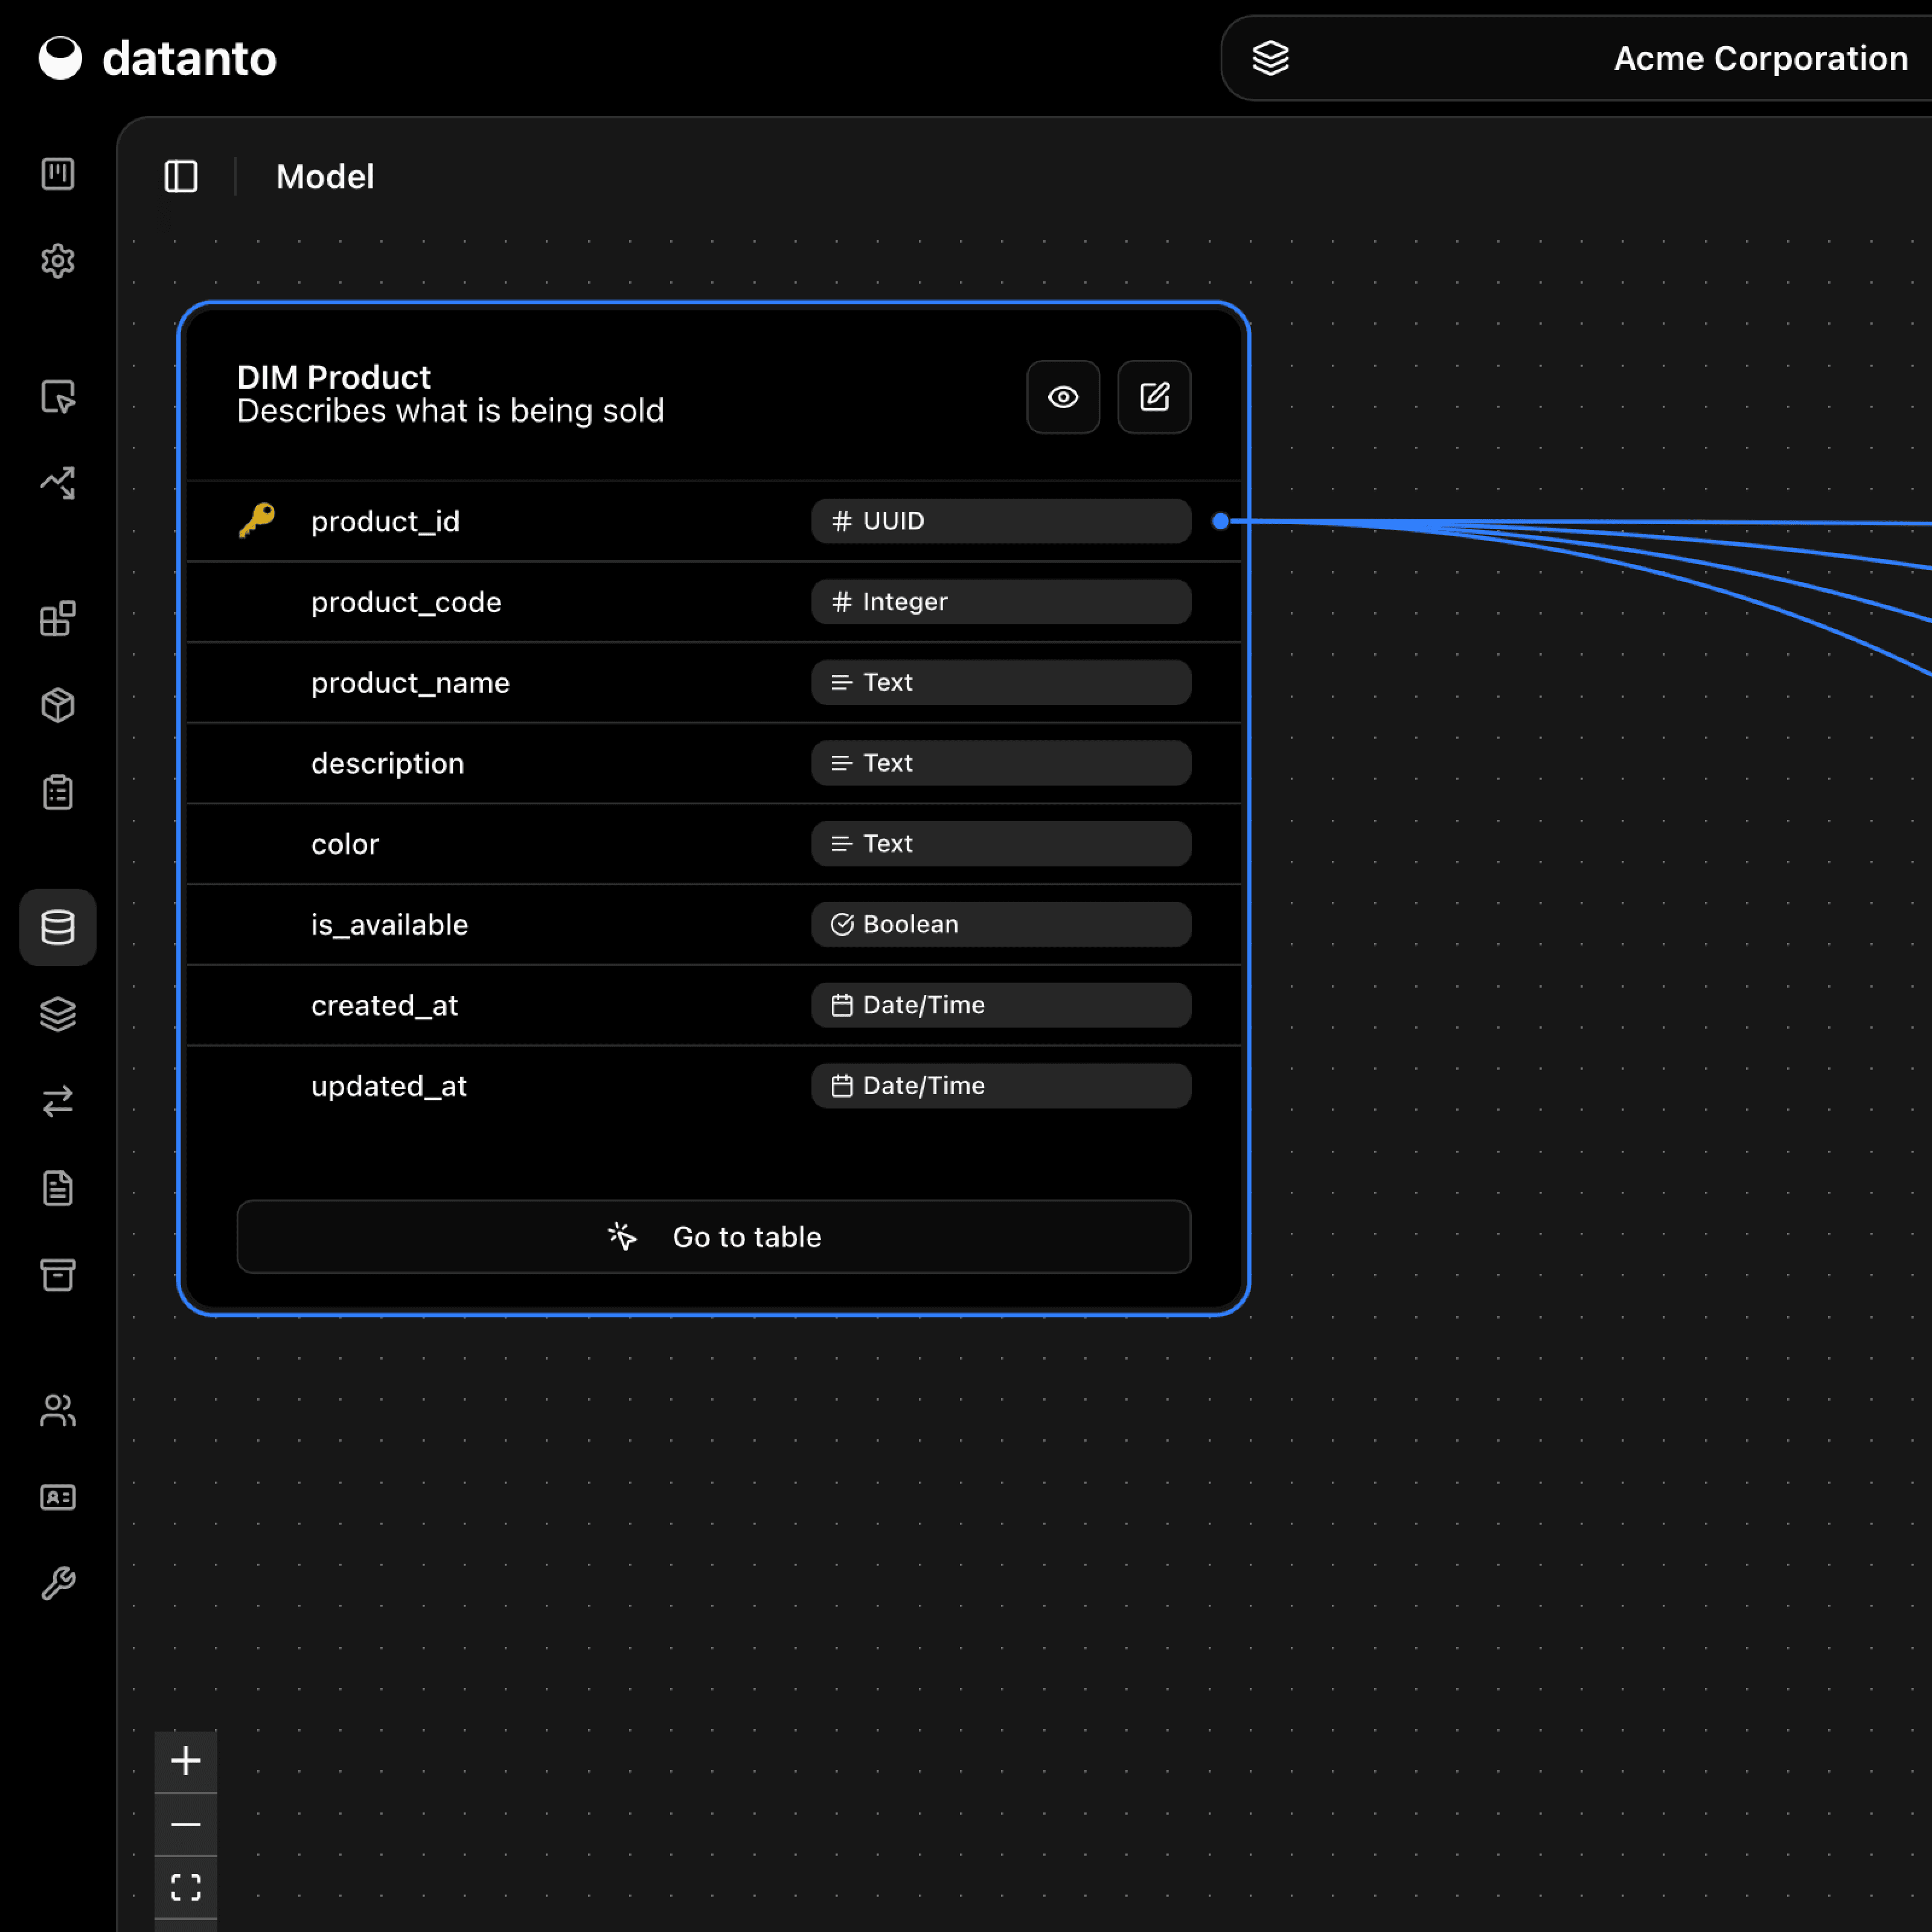
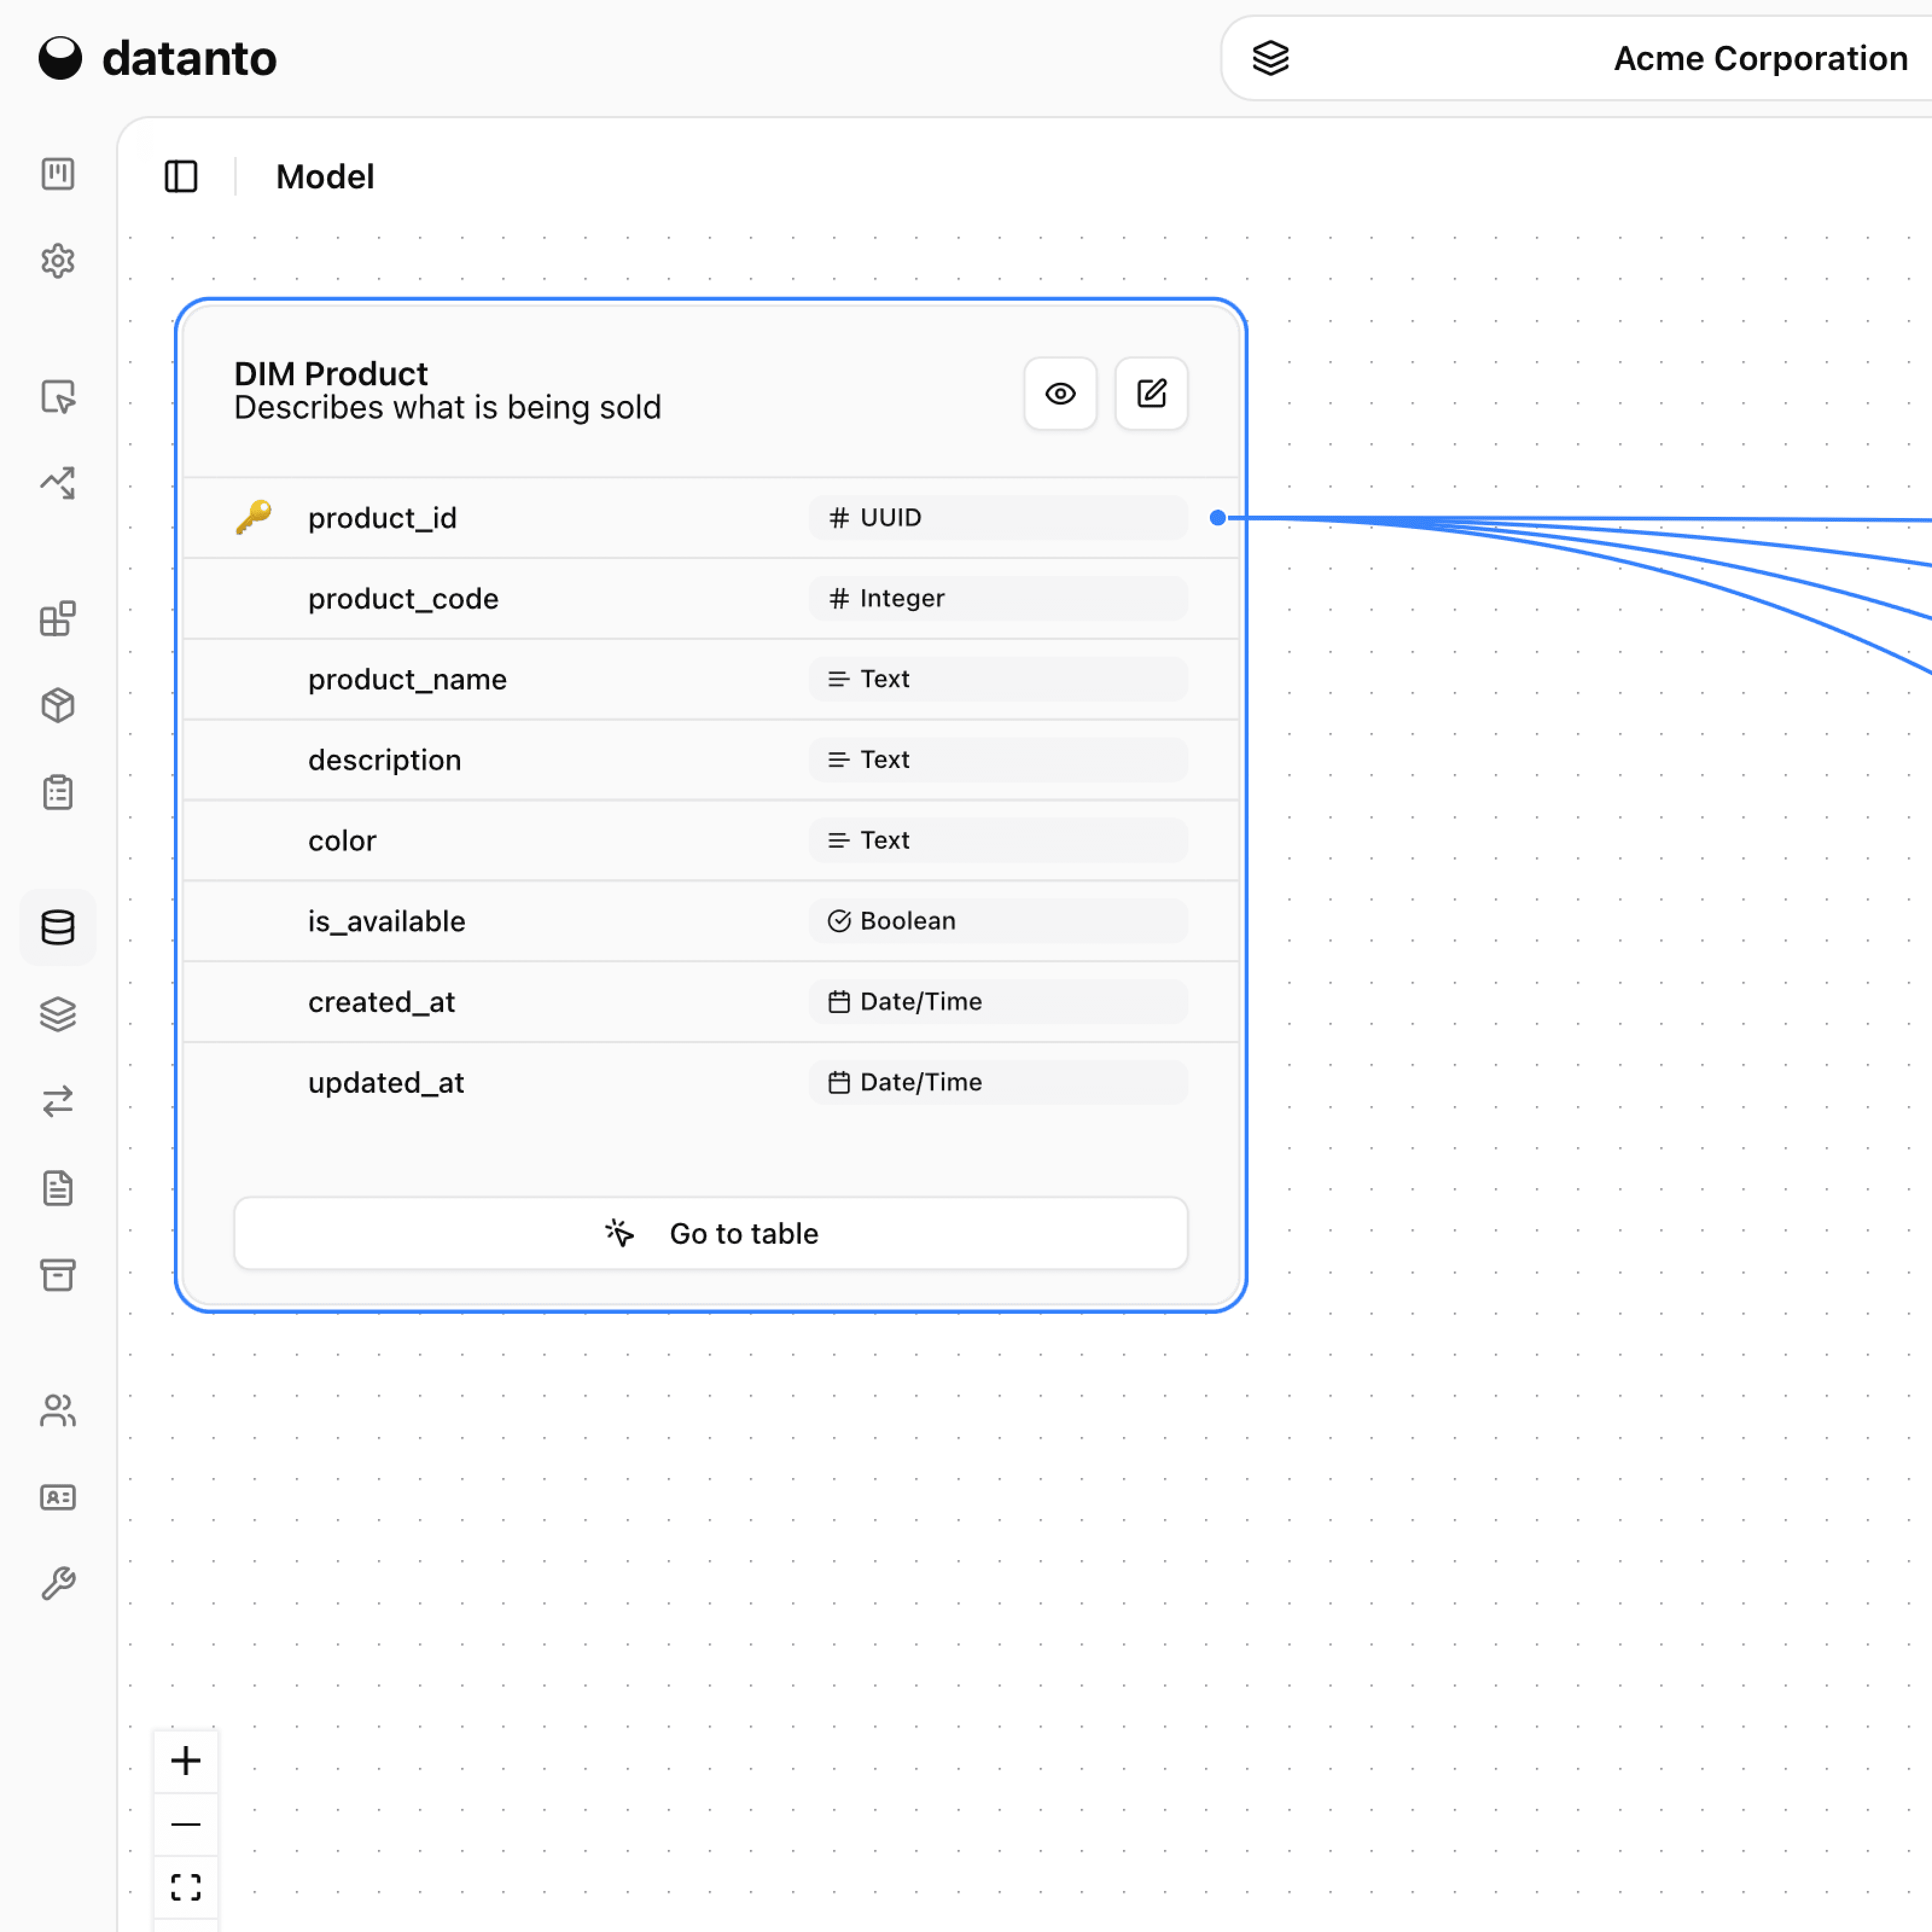
Foundation
Define metrics, dimensions, and relationships using your own terminology.
Anyone can explore data without writing SQL. The model translates intent into queries.
Revenue, margin, and KPIs mean the same thing everywhere — no more conflicting reports.
Business rules and access controls are embedded in the model itself.
why datanto
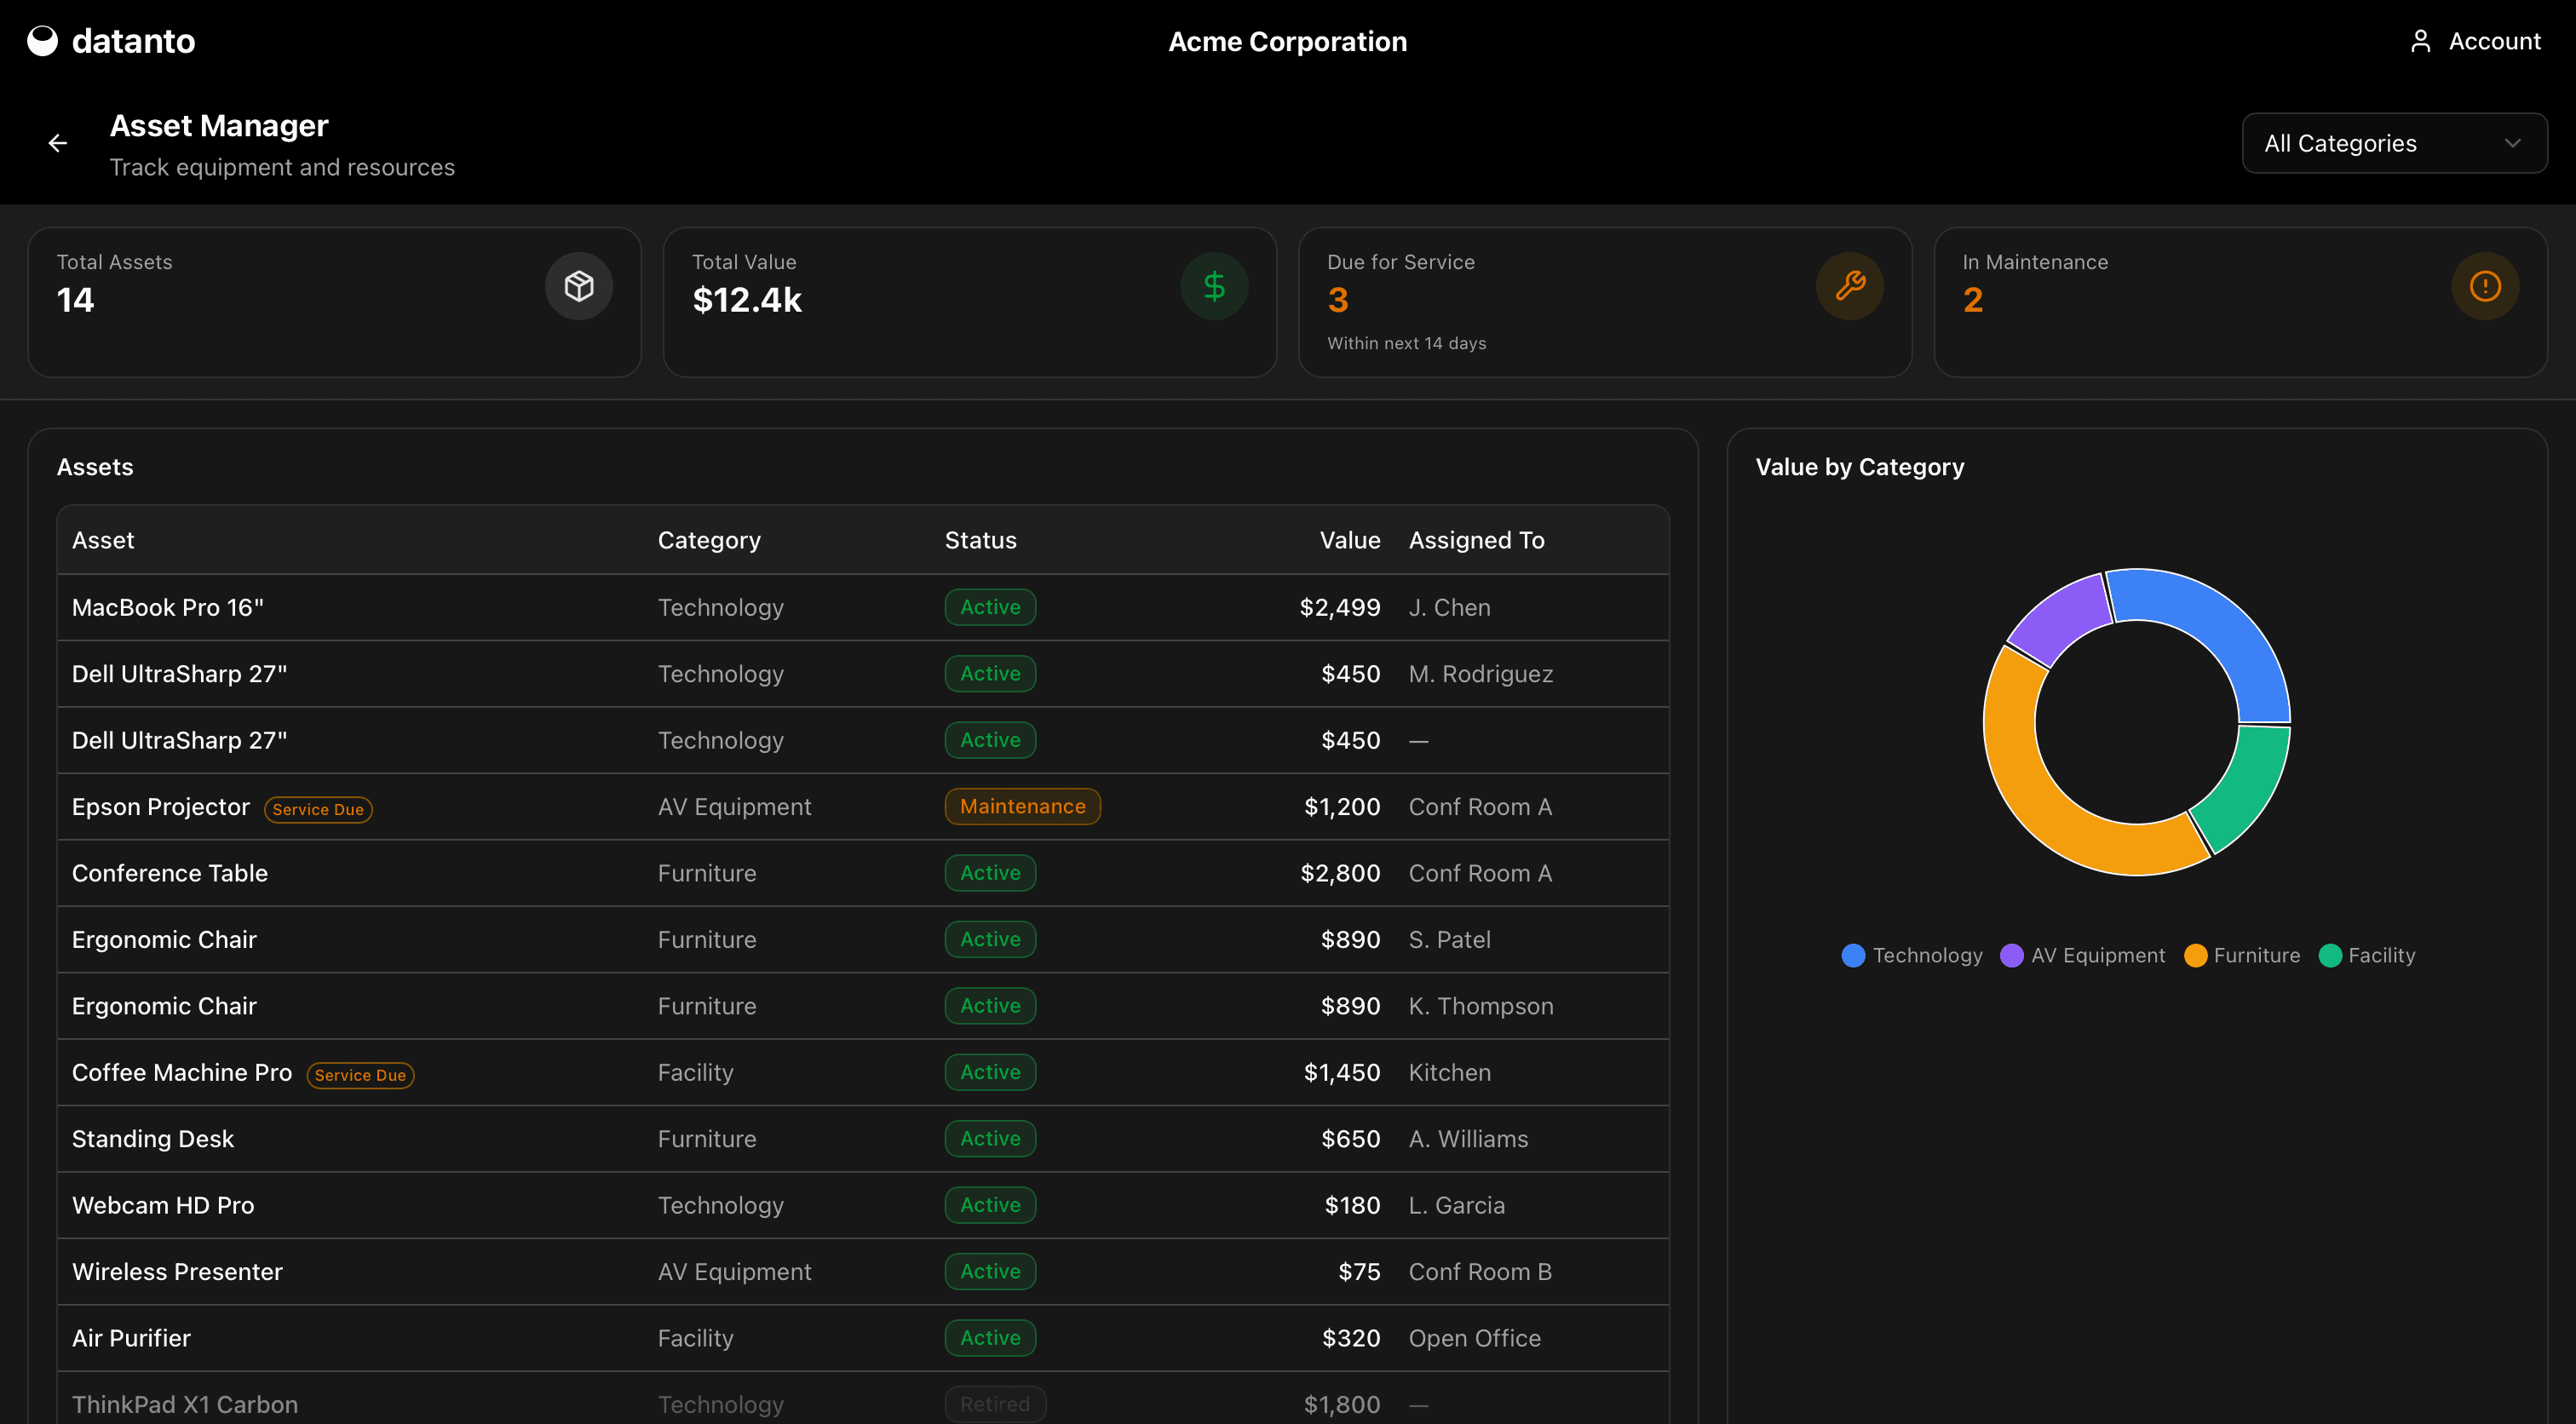
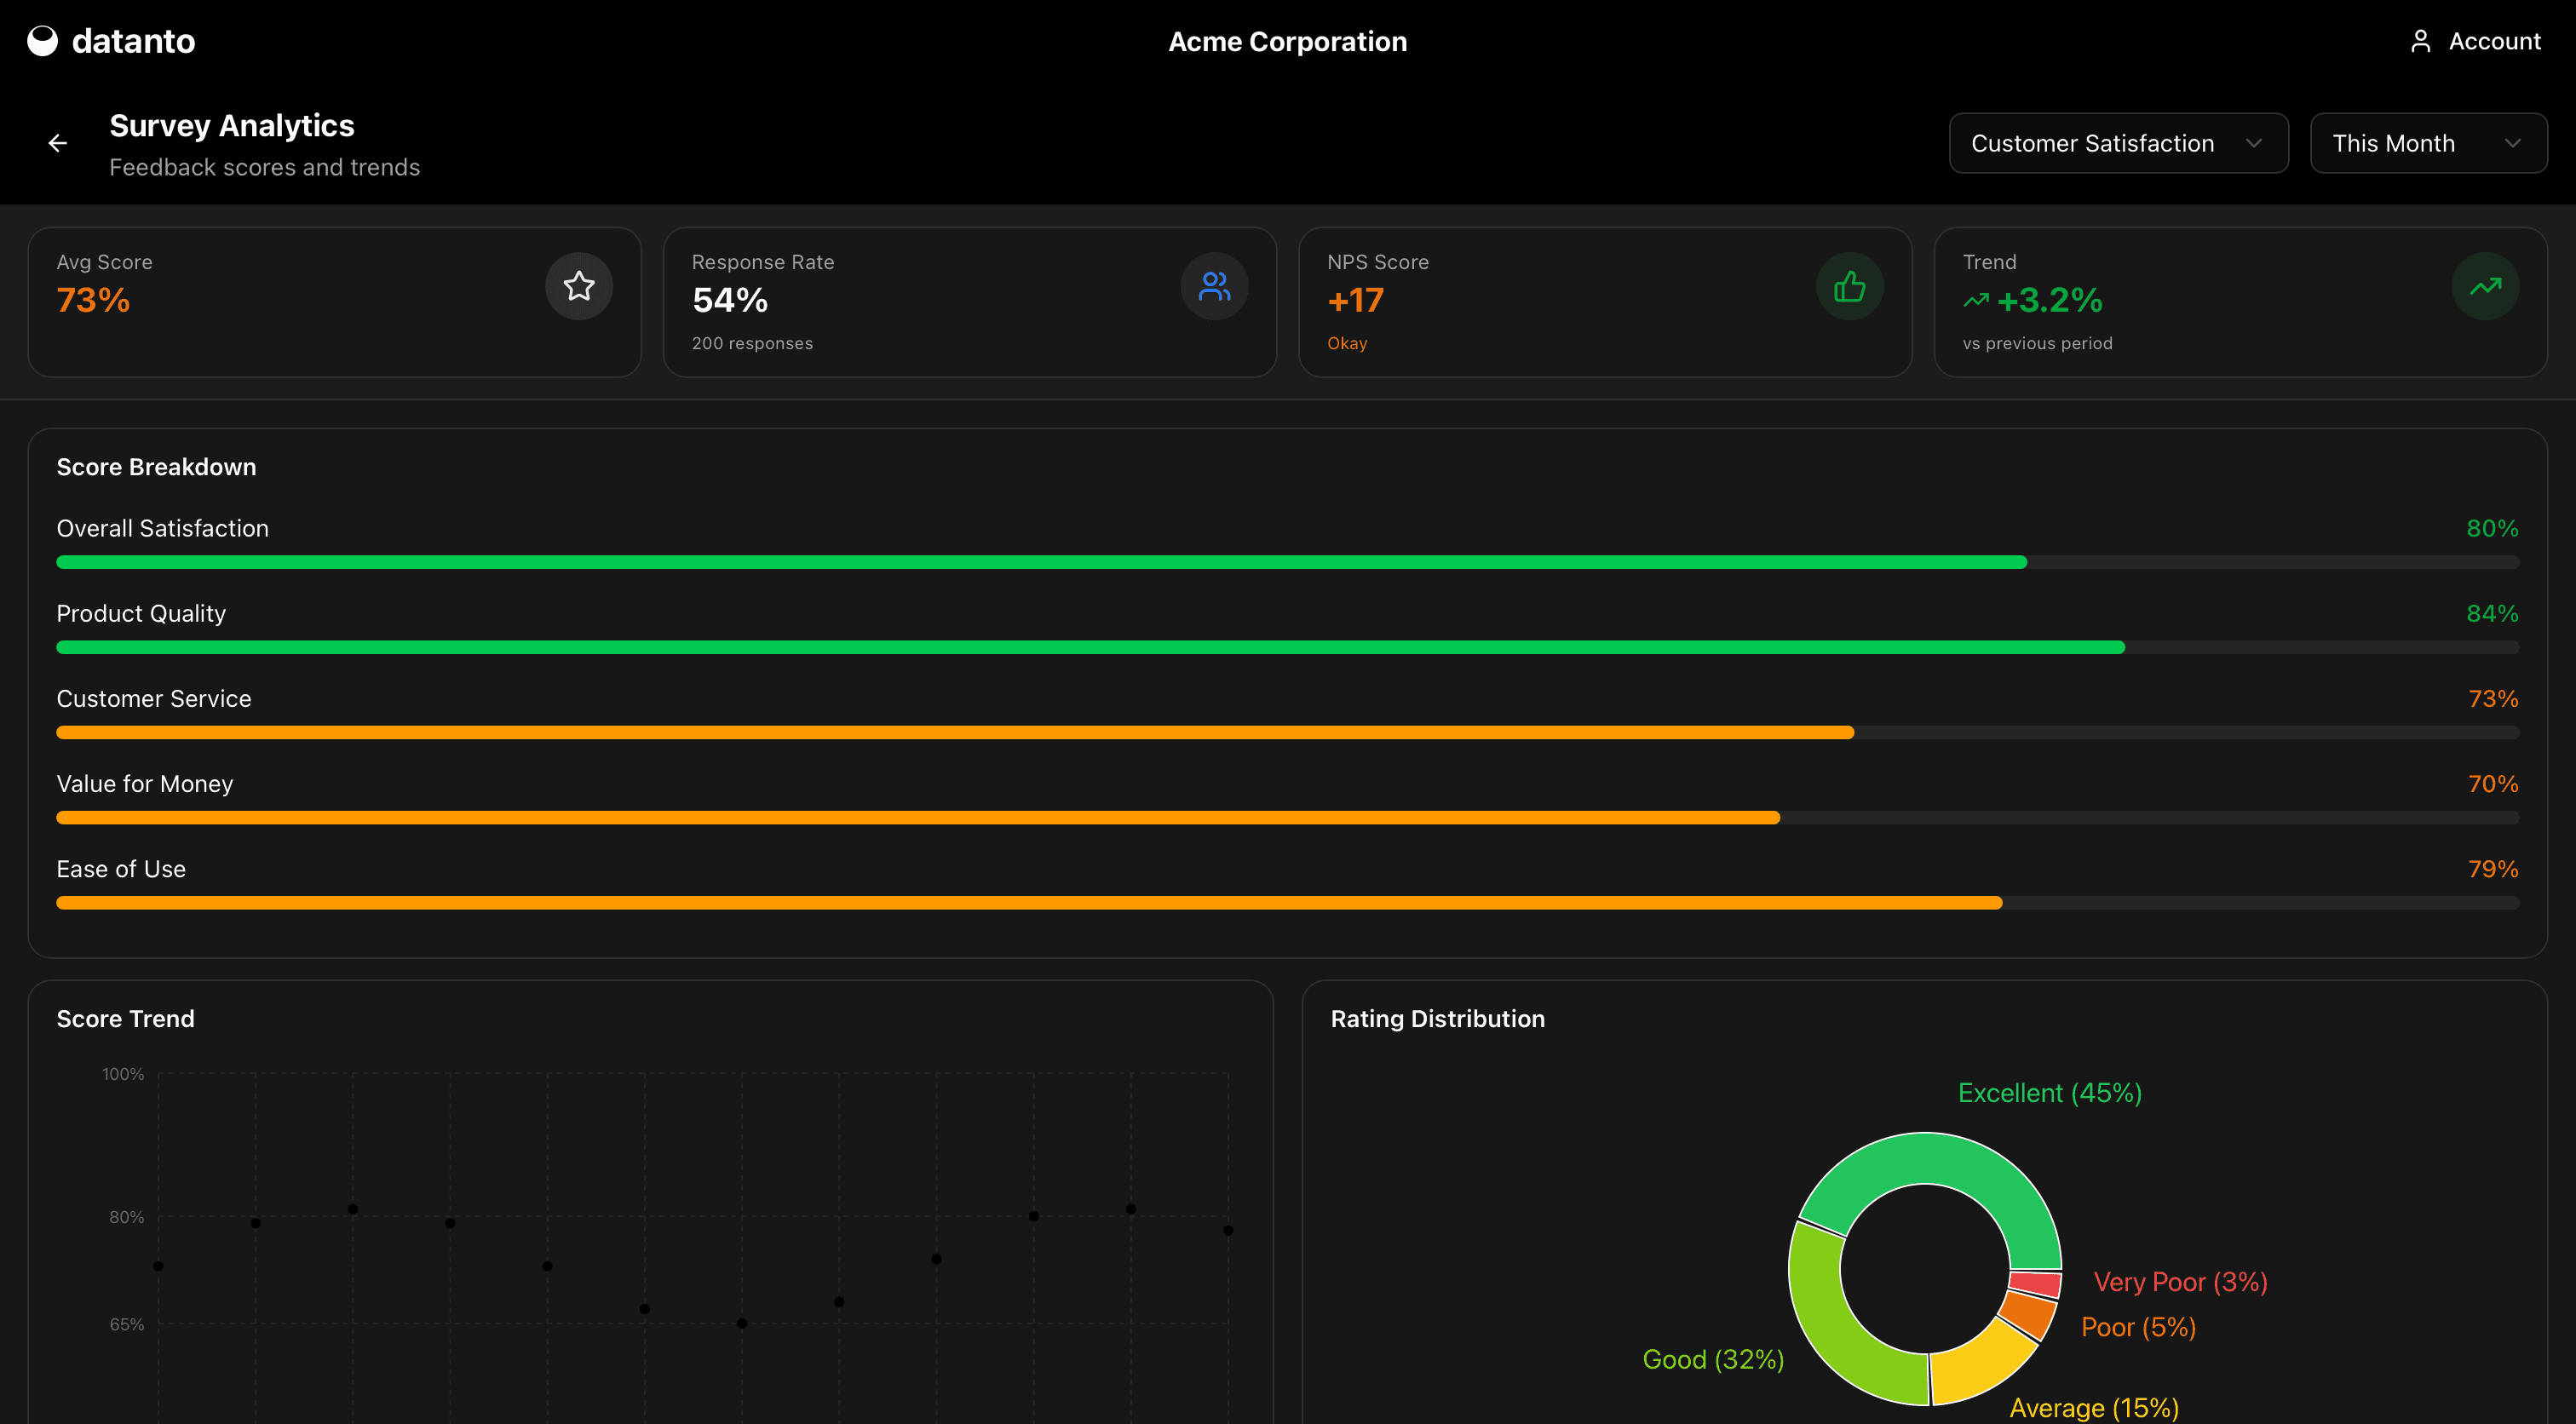
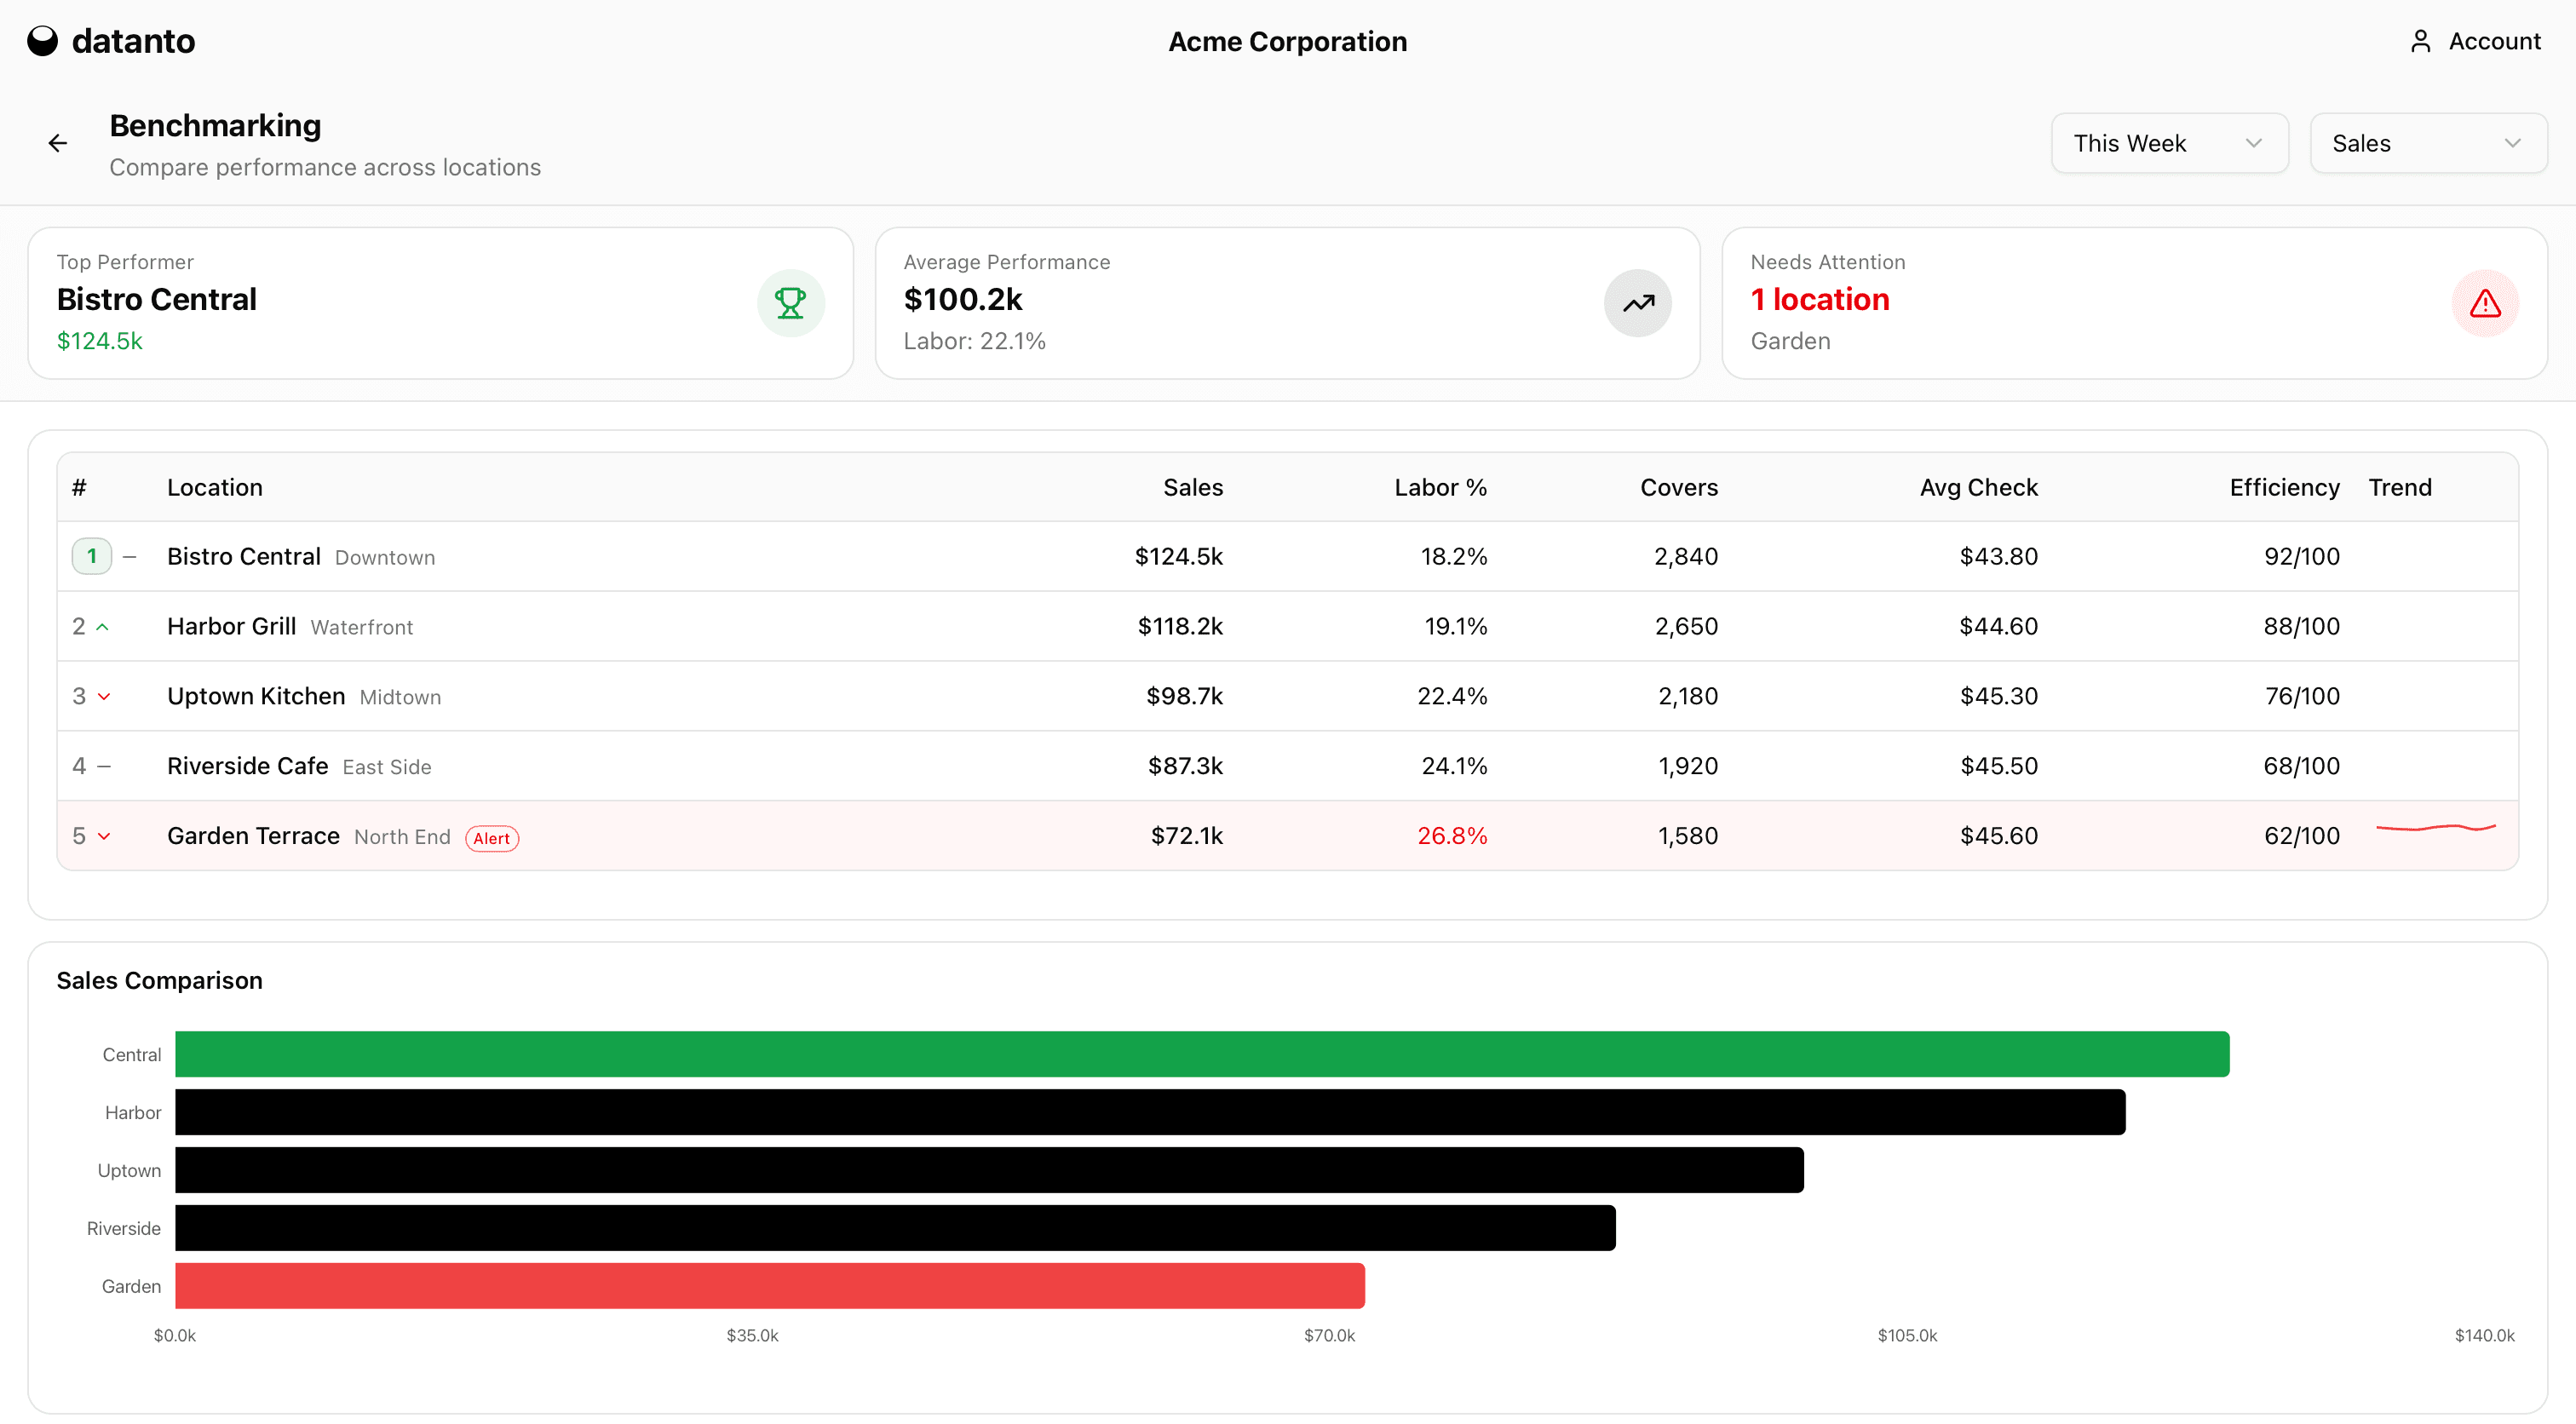
Turn questions into instant answers with interactive charts, tailored to your business context.
Widgets
Create charts, tables, and KPIs by asking questions in plain language. Each widget is generated from the shared data model, updates as data changes, and is scoped automatically by role and permissions.
Every widget is fully transparent: calculations, filters, and assumptions are visible and can be verified at any time.
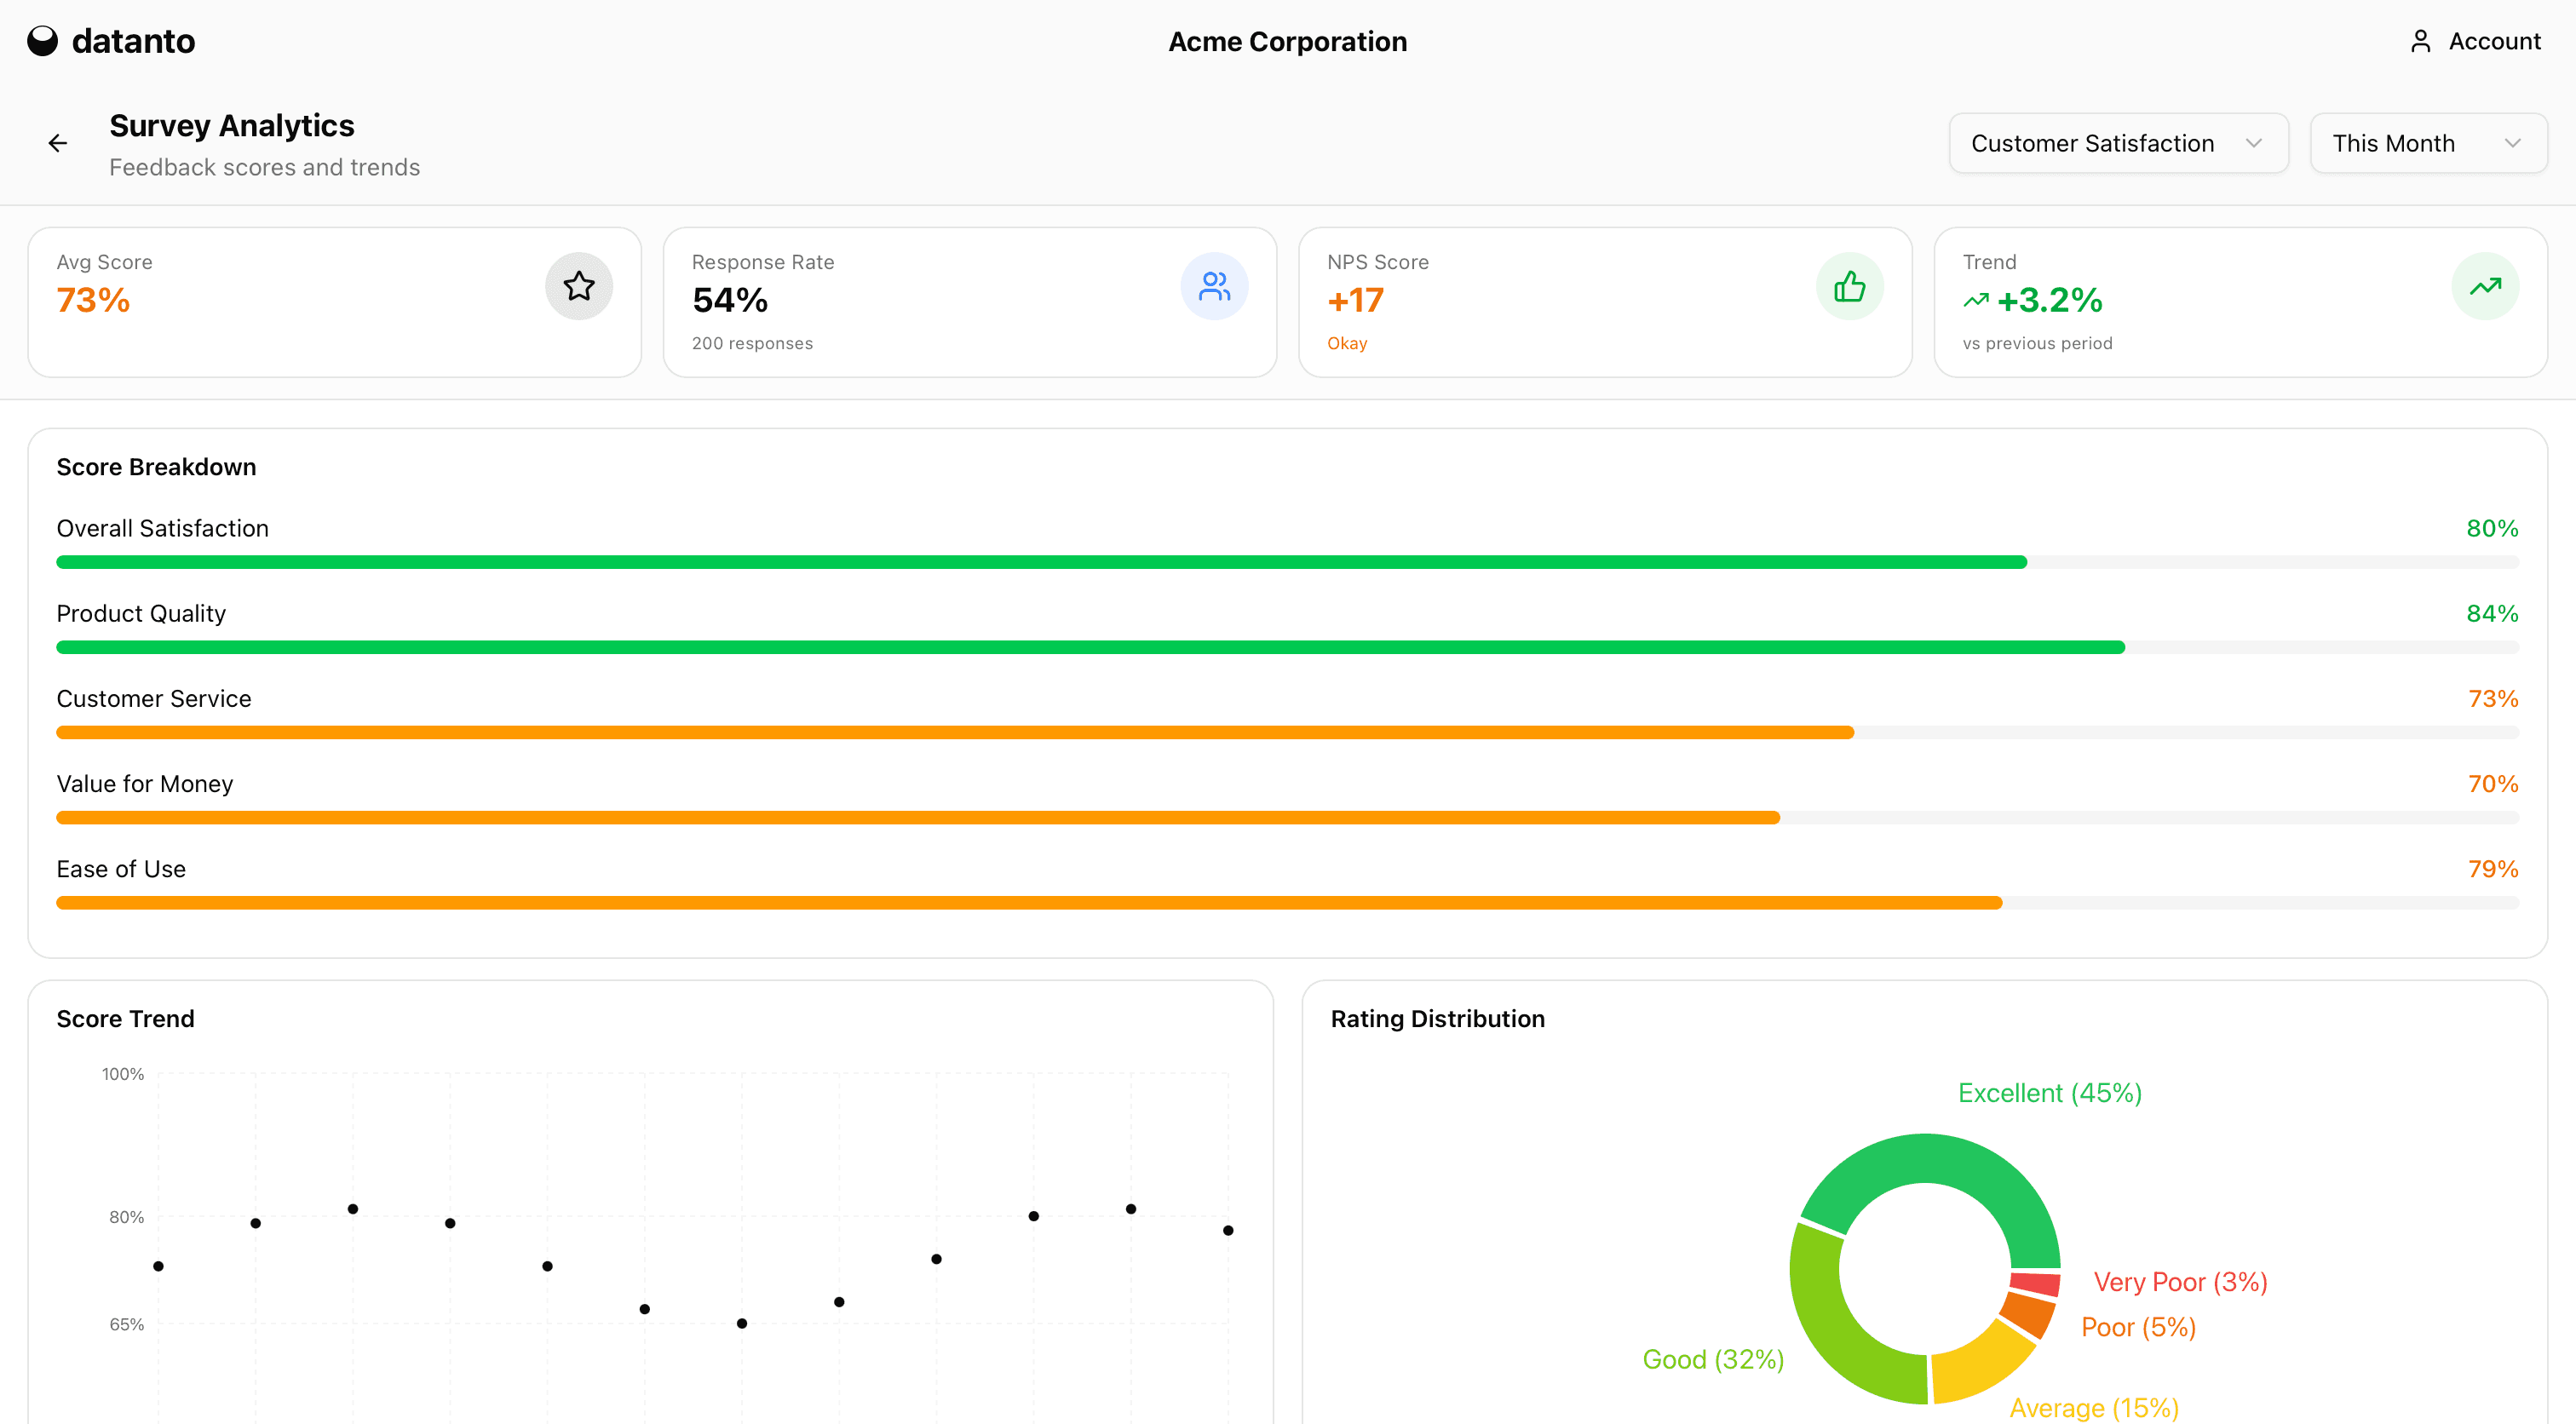
Forecasting widgets are generated automatically from the same data model and stay in sync as new data arrives.
Reporting
Share reports with your team from a single, reliable source. Each person sees exactly what they're allowed to see, based on role and scope.
Reports update in real time as new data arrives. They work on desktop and mobile, and can be exported to Excel or PDF when needed.
One report. One source of truth. Different views for different roles.
Introducing datanto GO
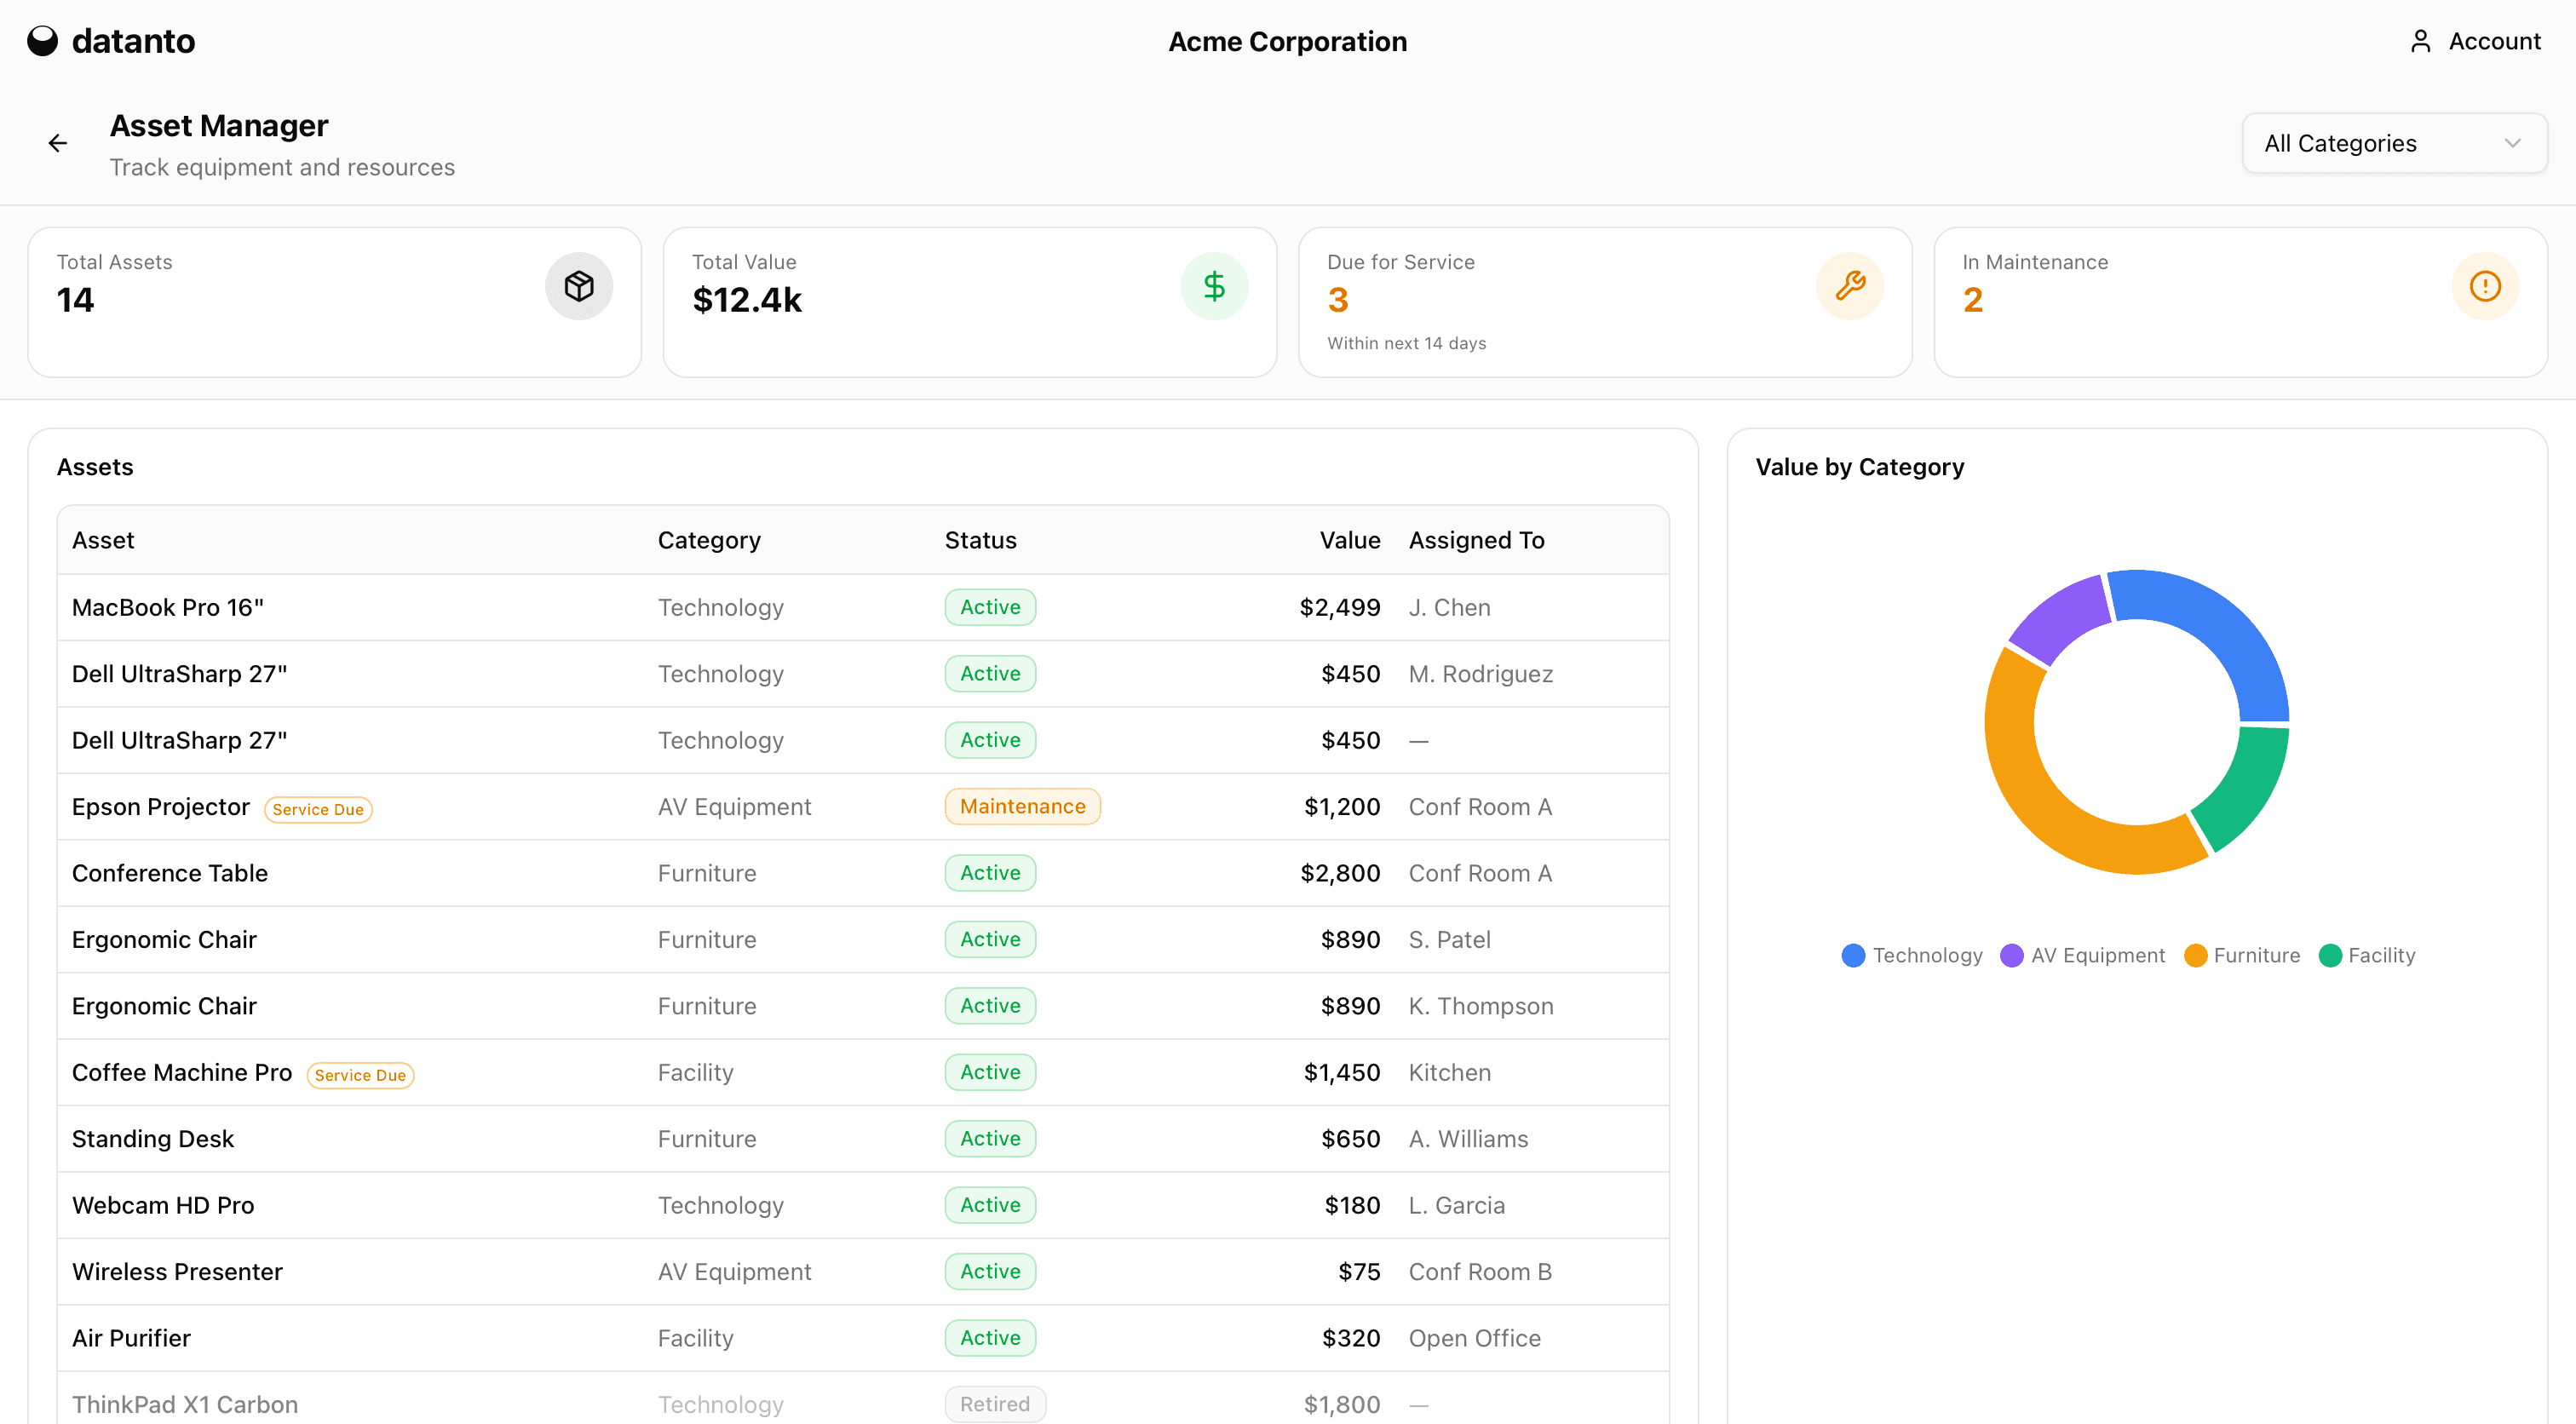
Every user sees the same system, but a personalized experience — filtered by role, responsibility, and scope.
Apps are built automatically from your semantic model. No code, no configuration, no maintenance.
Native experience on any device. Desktop, tablet, mobile — always in sync, always reliable.
Example
John is a Restaurant Manager at 123 Bistrot.
When he logs in, datanto automatically shows him: